FTSE 100, DAX 40, Dow Jones Analysis and Charts
FTSE 100 under pressure
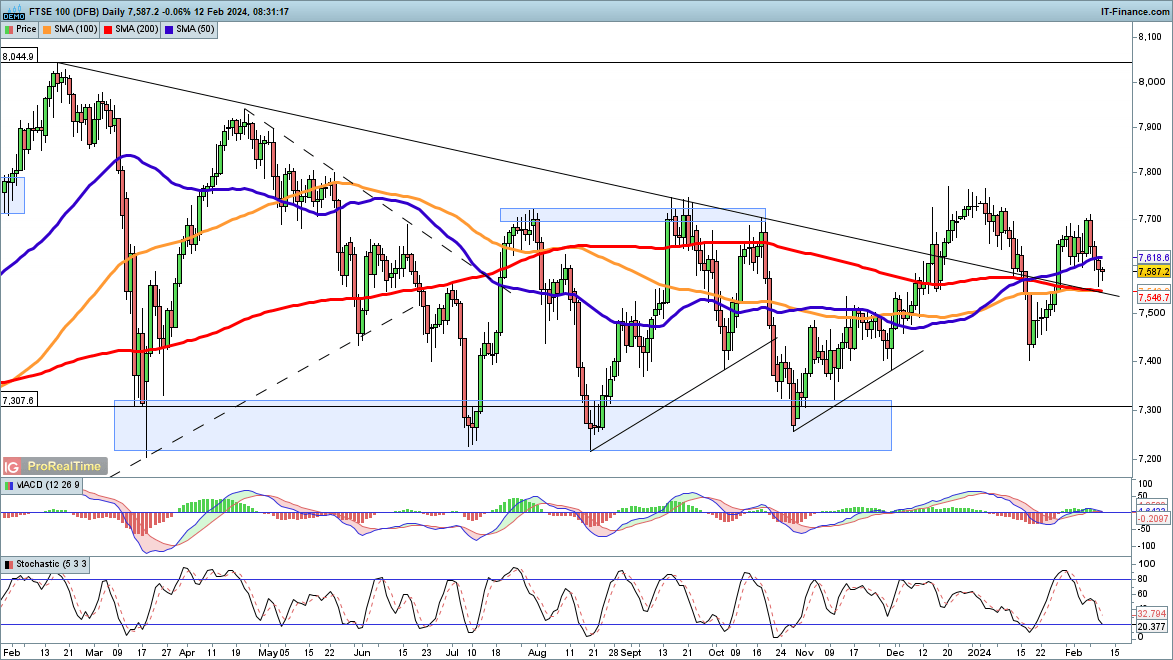
The index has fallen back for several days, retreating from 7700 and the lower high of early February.Having broken above trendline resistance from the 2023 highs during late January, the price may now retest the broken trendline from above. This would also coincide with the 200-day simple moving average (ISMA). A recovery above 7600 might yet signal that a low has been formed.
Additional declines target the late January low at 7400, and below this down towards 7250 and the support zone that lasted throughout 2023.
FTSE 100 Daily Chart
See how IG Client Sentiment can affect price action
| Change in | Longs | Shorts | OI |
| Daily | 17% | 8% | 9% |
| Weekly | -9% | 50% | 35% |
Dax holds near 17,000
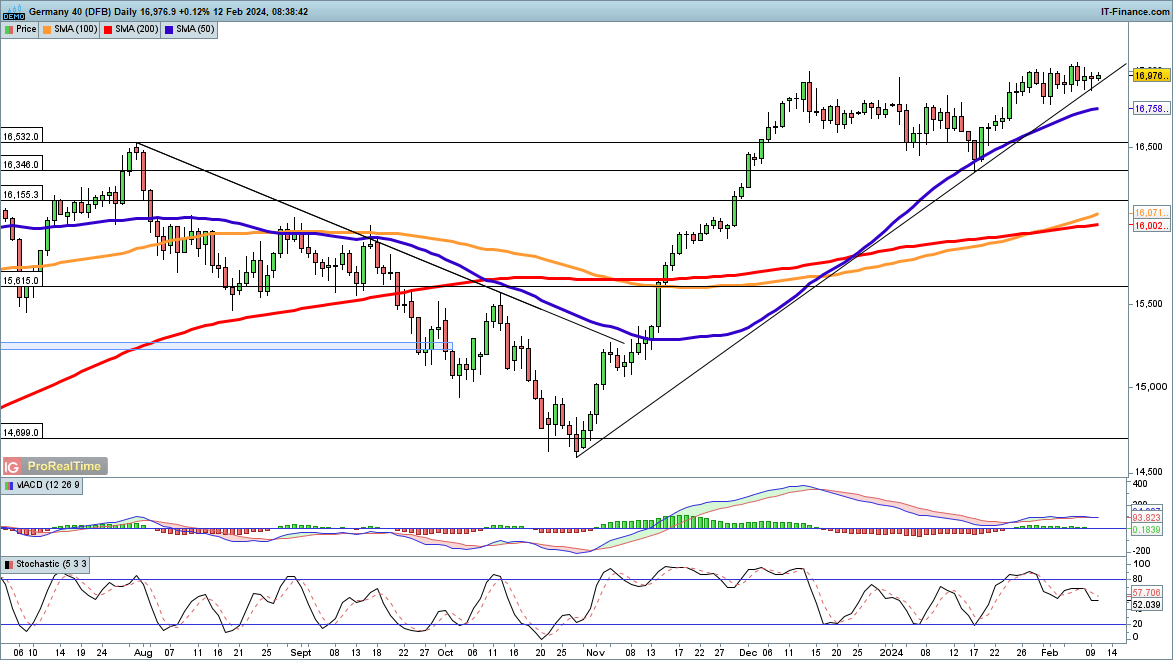
The Dax continues to consolidate around 17,000, but remains above trendline support from the October low.Mid-January weakness found buyers at the 50-day SMA, and in the short-term, a push to a fresh record high seems likely.
A near-term retracement requires a close back below the 50-day SMA to open the path to January’s low at 16,345, with some possible support before this at the previous record high of 16,532.
DAX 40 Daily Chart
New to trading? Download our free guide to help you start your journey


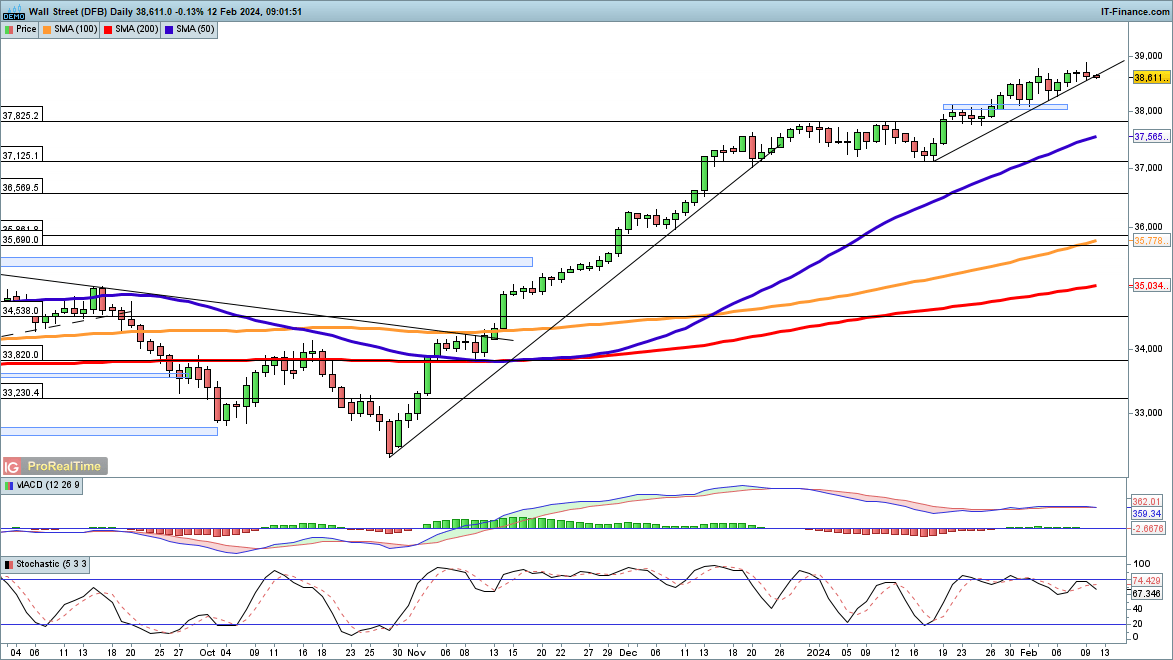
Dow drifts through trendline support
In what might be seen as a portentous development, the Dow is testing support from the mid-January low.In the short-term, further weakness could follow, potentially clearing the way to another test of the previous highs at 37,825.
Below this lies the 50-day SMA, and then down to 37,125, the low of December.
Dow Jones Daily Chart