
FTSE 100, DAX 40, S&P 500 Analysis and Charts
- FTSE 100 recovery continues despite weak UK retail sales
- DAX 40 recovers from this week’s six-week low
- S&P 500 resumes its ascent
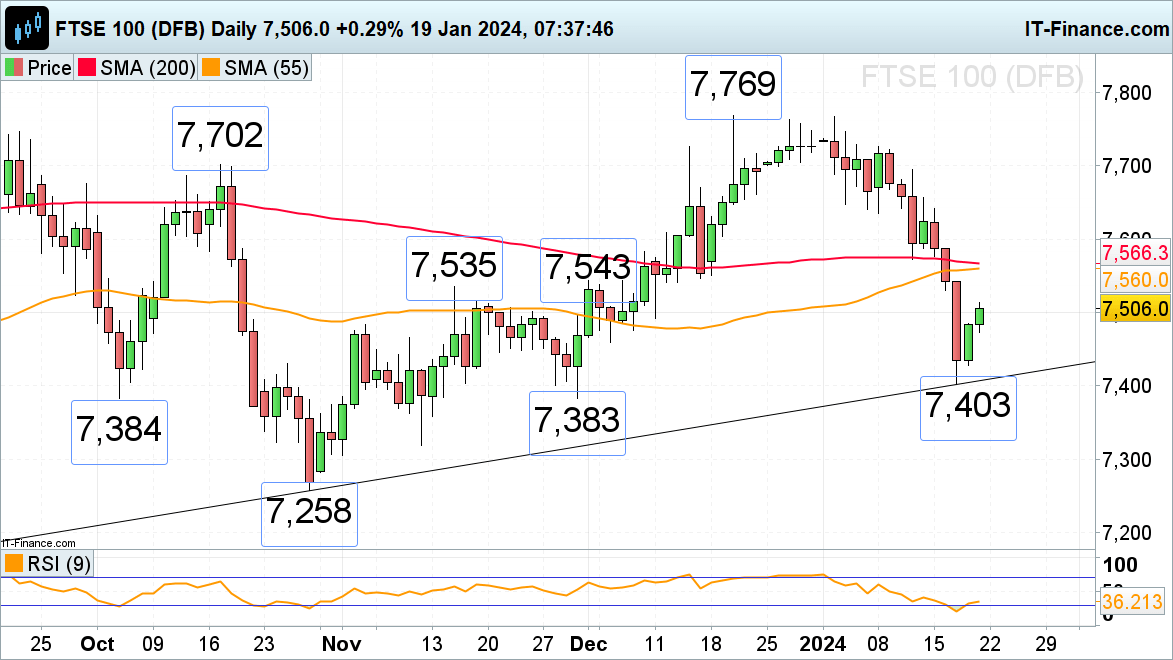
FTSE 100 recovery continues despite weak UK retail sales
The FTSE 100, which on Wednesday fell to a six-week low at 7,403 on pared back rate cut expectations, is in recovery mode despite UK retail sales falling the most in nearly three years. The mid-November and early December highs at 7,535 to 7,543 represent the next upside target zone but together with the 55- and 200-day simple moving averages (SMA) at 7,560 to 7,566 may thwart the advance, at least short-term.
Minor support sits at Thursday’s 7,485 high ahead of Friday’s 7,473 intraday low and the 5 December 7,459 low.
FTSE 100 Daily Chart

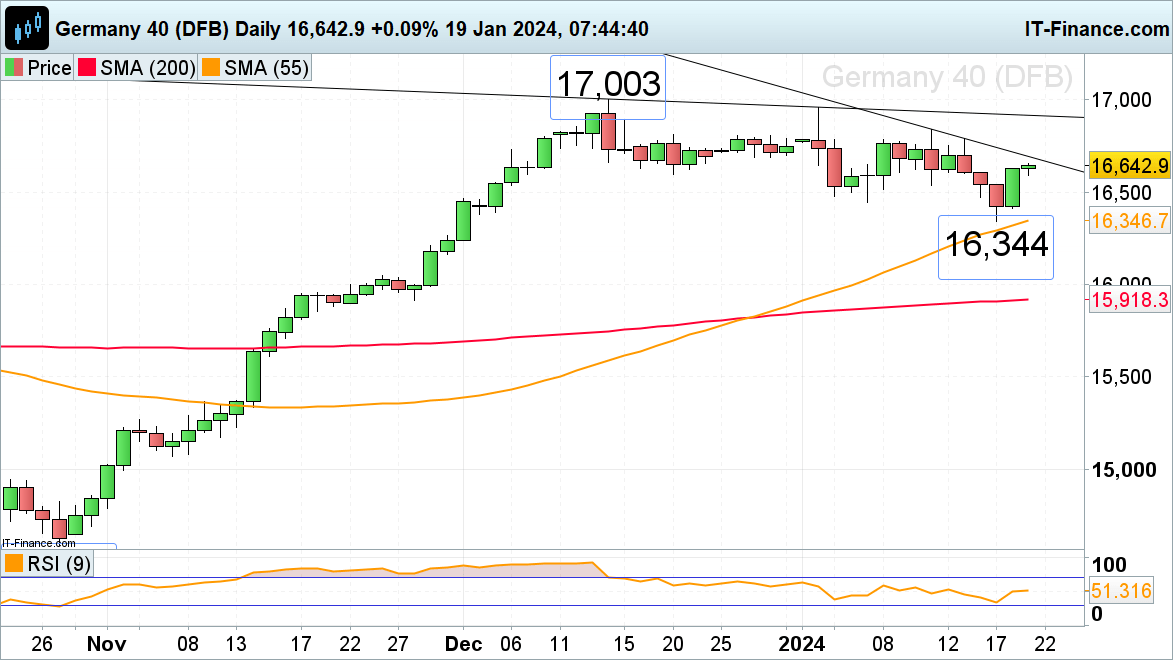
DAX 40 recovers from this week’s six-week low
The DAX 40 index is in the process of bottoming out ahead of European Central Bank (ECB) Governor Christine Lagarde’s speech at Davos today with the January resistance line at 16,690 representing the first upside target. Further up sits the 8 January high at 16,785 below the more significant 11 and 15 January highs at 16,792 to 16,841.
Slips should find support around Wednesday’s high and last week’s low at 16,543 to 16,517.Further down lie the early January andThursday’s low at 16,444 to 16,409.
DAX 40 Daily Chart
Retail trader data shows 22.65% of traders are net-long with the ratio of traders short to long at 3.41 to 1. The number of traders net-long is 21.38% lower than yesterday and 16.35% higher than last week, while the number of traders net-short is 7.60% higher than yesterday and 3.41% lower than last week.
See how daily and weekly changes in sentiment can affect the DAX 40 outlook.
| Change in | Longs | Shorts | OI |
| Daily | 1% | 0% | 0% |
| Weekly | -10% | 11% | 5% |
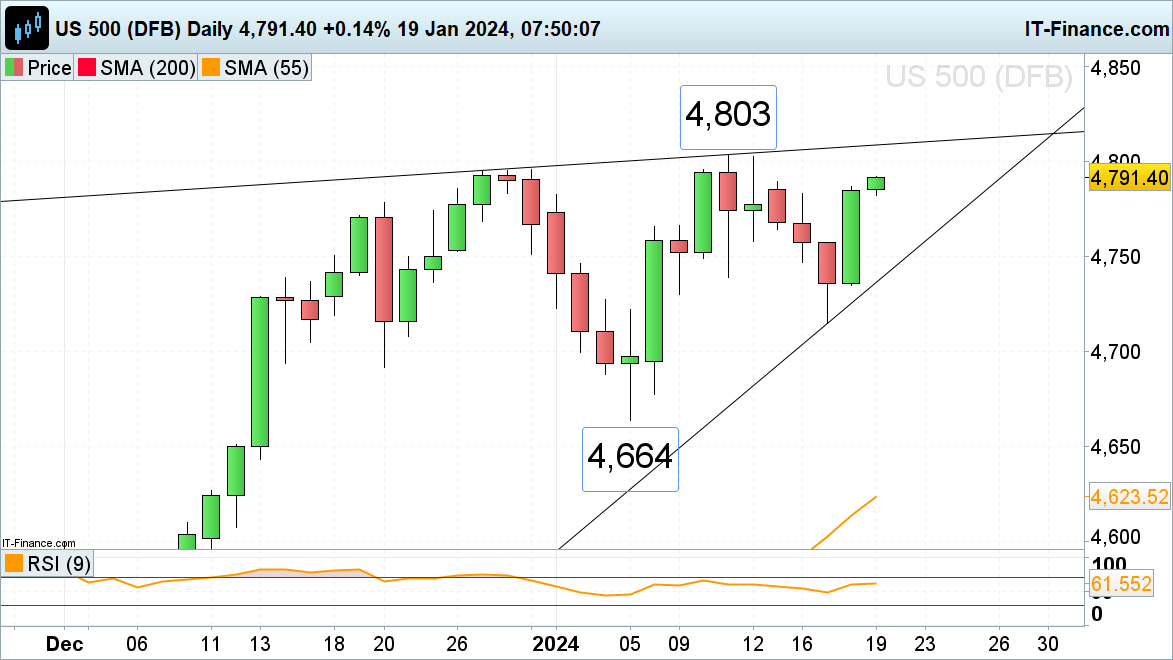
S&P 500 resumes its ascent
The S&P 500 surged higher on Thursday as US building permits rose more than expected, jobless claims plunged to a 16-month low and the S&P information technology sector hit a record high. The December to January highs at 4,795 to 4,803 are thus back in the frame.
Minor support below the 20 December high at 4,778 can be spotted around the 9 January high at 4,766.
S&P 500 Daily Chart