FTSE 100, DAX 40, S&P 500 Analysis and Charts

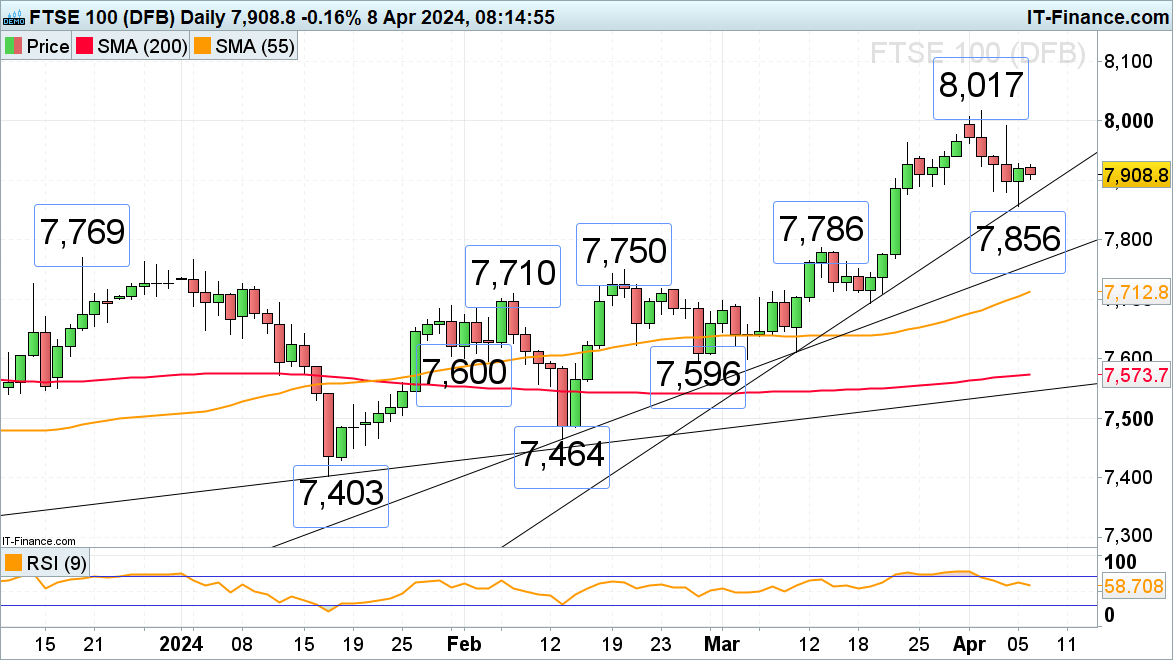
FTSE 100 tries to stabilize
The FTSE 100 on Thursday tried to overcome the 8,000 mark but didn’t manage to do so before slipping to 7,856 until a post Non-Farm Payrolls recovery rally took the index back above the 7,900 level. While the two-month uptrend line at 7,871 underpins, together with last week’s 7,856 low, a stabilizing move to the upside may unfold.
A fall through Friday’s low at 7,856 would put the December to mid-March highs at 7,786 to 7,769 back on the map, though.Minor resistance remains to be seen at the 22 March high at 7,962.
FTSE 100 Daily Chart
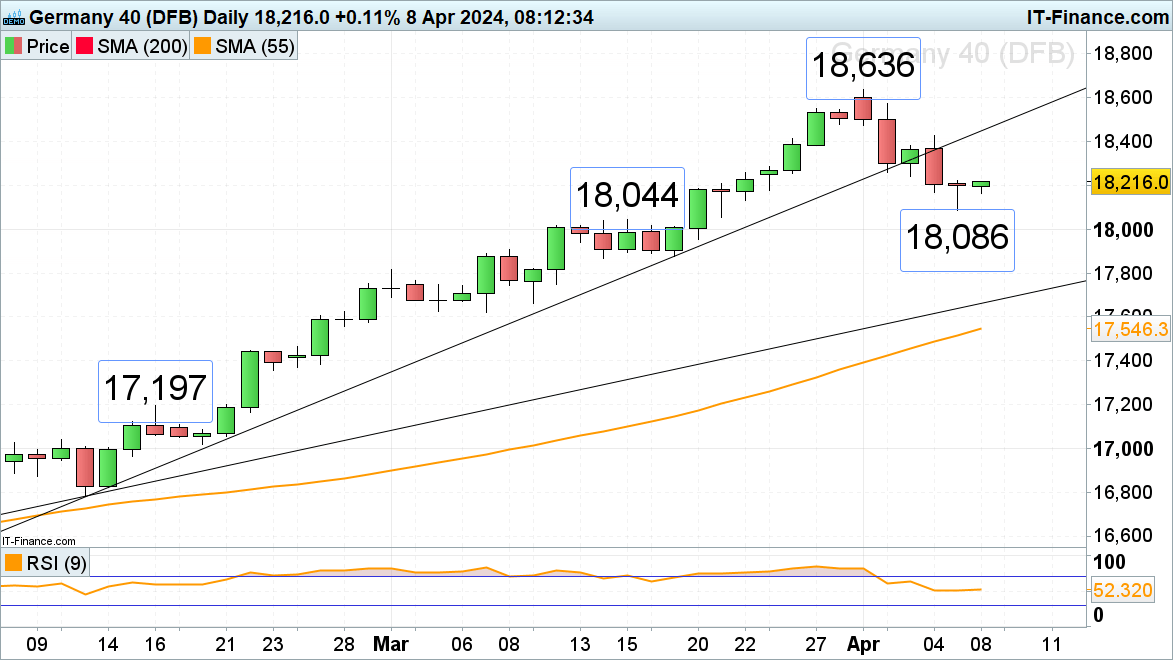
DAX 40 regains lost ground
The DAX 40’s bounce off Friday’s low at 18,086 post much stronger-than-expected US employment data is taking the index to Tuesday’s 18,258 low. Further up Thursday’s high at 18,429 and the breached February-to-April uptrend line, now because of inverse polarity a resistance line, at 18,442 may cap.
DAX 40 Daily Chart
See how changes in Retail Sentiment can affect price action
| Change in | Longs | Shorts | OI |
| Daily | 36% | 4% | 11% |
| Weekly | 4% | 6% | 6% |
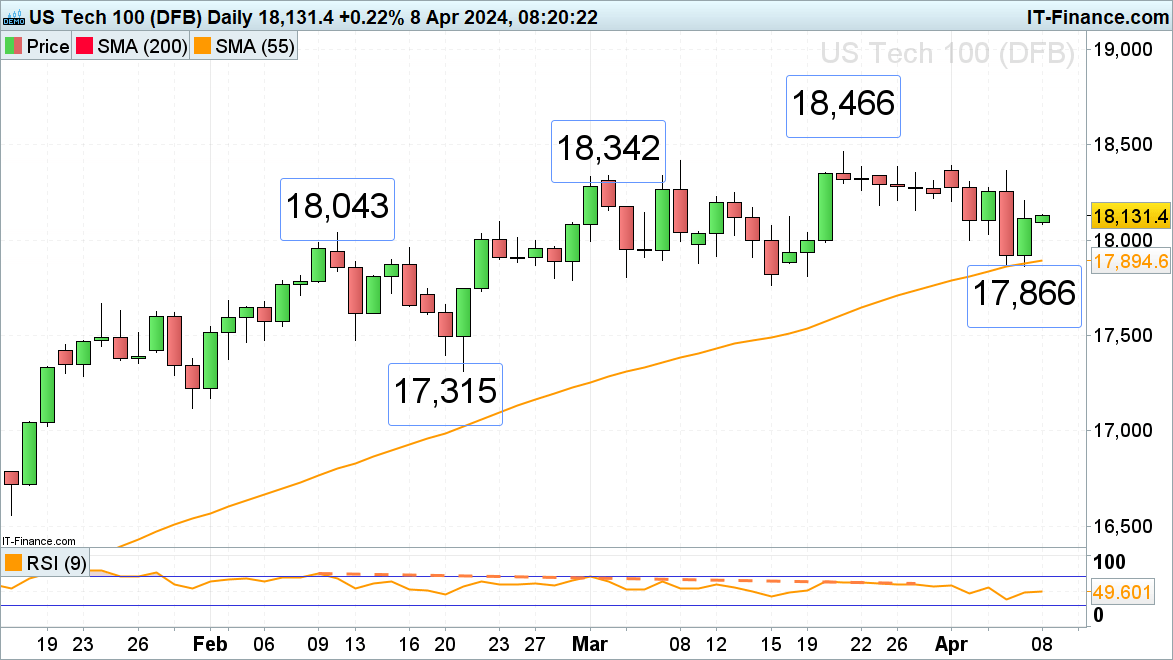
Nasdaq 100 recovers from a two-week low
The Nasdaq 100’s corrective move lower took it to Friday’s trough at 17,866 before strong US employment data propelled it to Friday’s 18,211 high. This level represents an immediate upside target while support sits around Tuesday’s 17,997 low.
More significant support can be found between the 55-day simple moving average (SMA) at 17,894 and last week’s low at 17,866.
Nasdaq100 Daily Chart