FTSE 100, DAX40, Nasdaq 100 Analysis and Charts

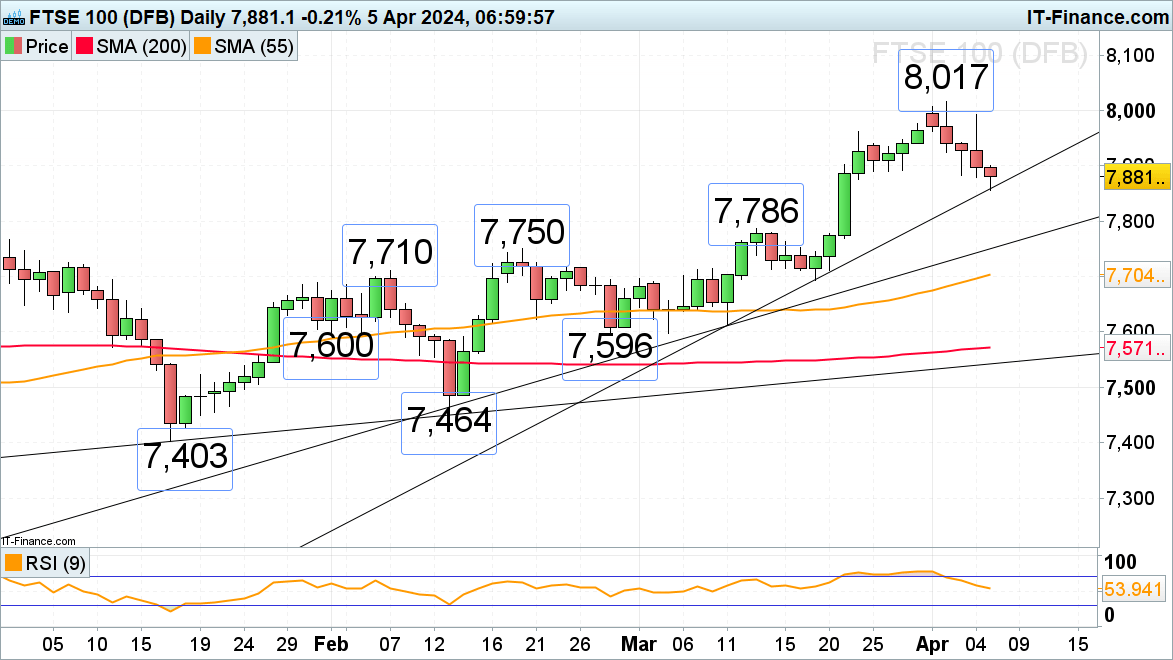
FTSE 100 retested but was then rejected by the 8,000 region
The FTSE 100 on Thursday tried to regain the 8,000 mark but fell just short of this level before dropping towards its March-to-April uptrend line as some Fed officials raised doubts on the timing of potential rate cuts this year.
The two-month uptrend line at 7,856 has been probed in early morning trading ahead of today’s key US Non-Farm Payrolls report.A fall through Friday’s intraday low at 7,856 would put the December to mid-March highs at 7,786 to 7,769 back on the cards.
Minor resistance can be encountered at the 22 March high at 7,962.
FTSE 100 Daily Chart
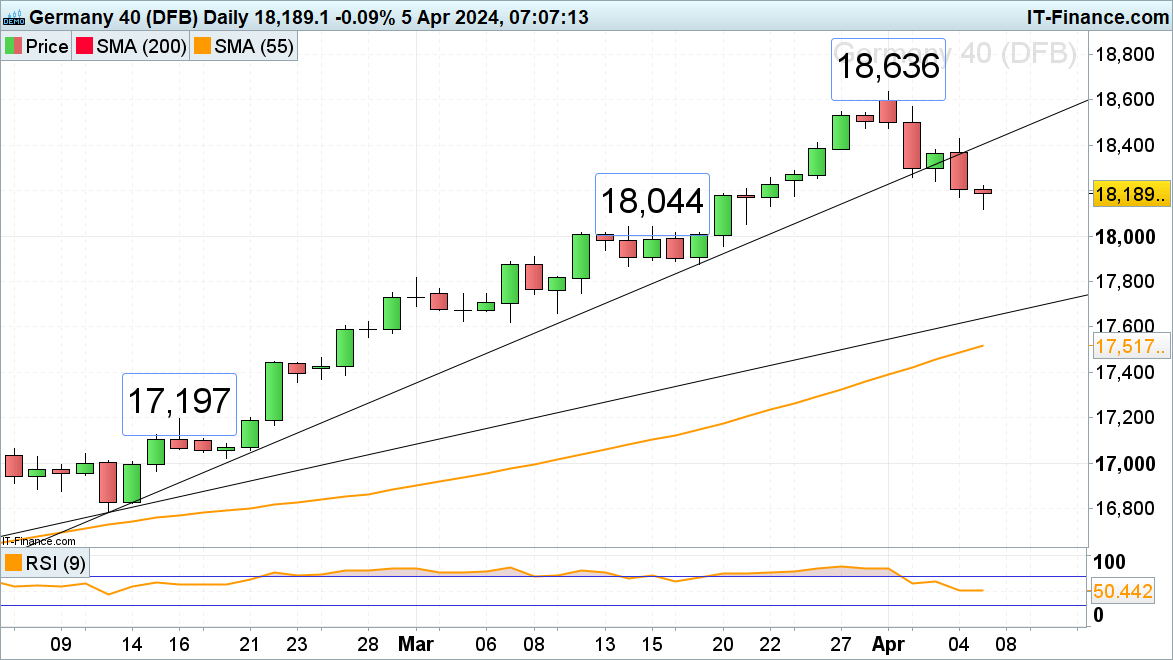
DAX 40 drops to one-week low
The DAX 40 reversed lower on Tuesday and so far slid to Friday’s intraday low at 18,119 ahead of key US employment data. Below this level, support can be found around the 18,044 mid-March high and the 18,000 region.
Minor resistance is seen at Tuesday’s 18,258 low. Above it minor resistance sits around the 27 March low at 18,382.
DAX 40 Daily Chart


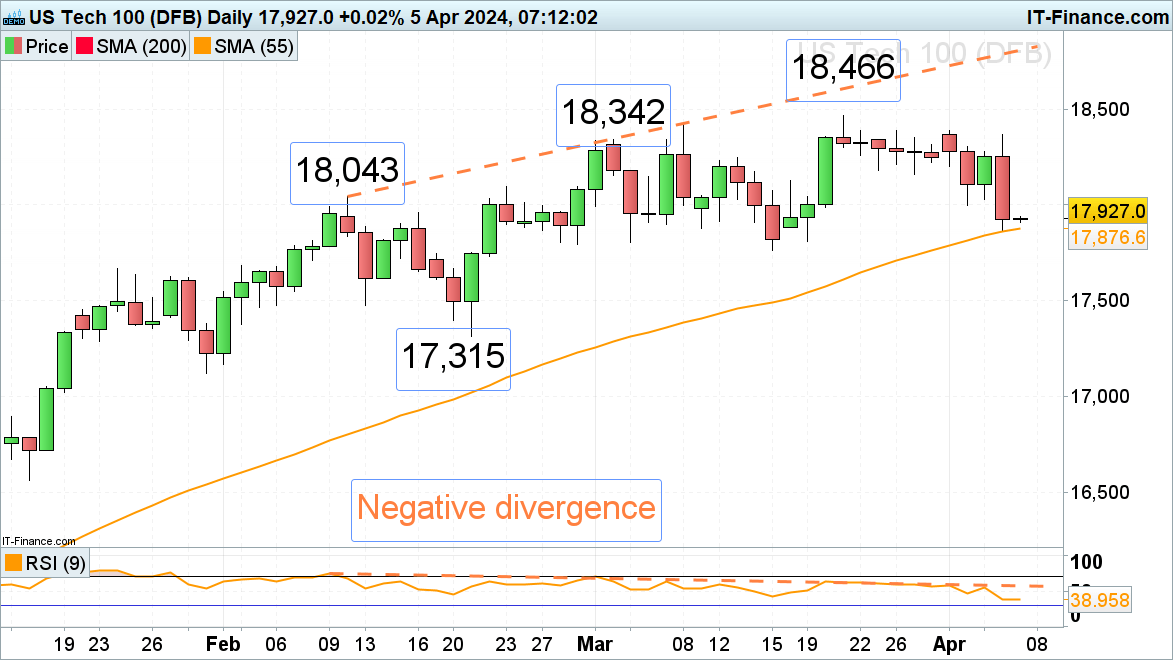
Nasdaq 100 hits two-week low
The Nasdaq 100’s corrective move lower gained traction on Thursday as Fed official's speeches led to rate cut expectations being pared back with the index slipping to the 55-day simple moving average (SMA) at 17,877 which offered support. Below it the late February and March lows at 17,791 to 17,762 offer support, a fall through which would put the late January high at 17,668 on the cards.
Minor resistance above Tuesday’s 17,997 low comes in at the 18,157 late March low.
Nasdaq 100 Daily Chart