


US Dollar, Euro, EUR/USD - Technical Outlook:
- EUR/USD is struggling to break above key resistance
- The broader bias for the single currency remains down
- What is the short-term outlook and what are the key levels to watch?

EUR/USD TECHNICAL FORECAST – BEARISH
The retreat late last week from near key resistance is a sign that EUR/USD’s recent rally could be running out of steam.
The pair briefly rose past immediate resistance at the early-October high at parity, coinciding with the upper edge of a falling channel from April and giving the impression that the rebound could extend. However, it would be too soon to conclude that a valid resistance break has occurred. The single currency hasn’t been able to clear tough resistance on the 89-day moving average, which has capped rallies since the beginning of 2022. It might be prudent to wait for a break above this barrier (now at about 1.0110) before concluding that a short-term low in EUR/USD has been set (see chart).
EUR/USD Daily Chart
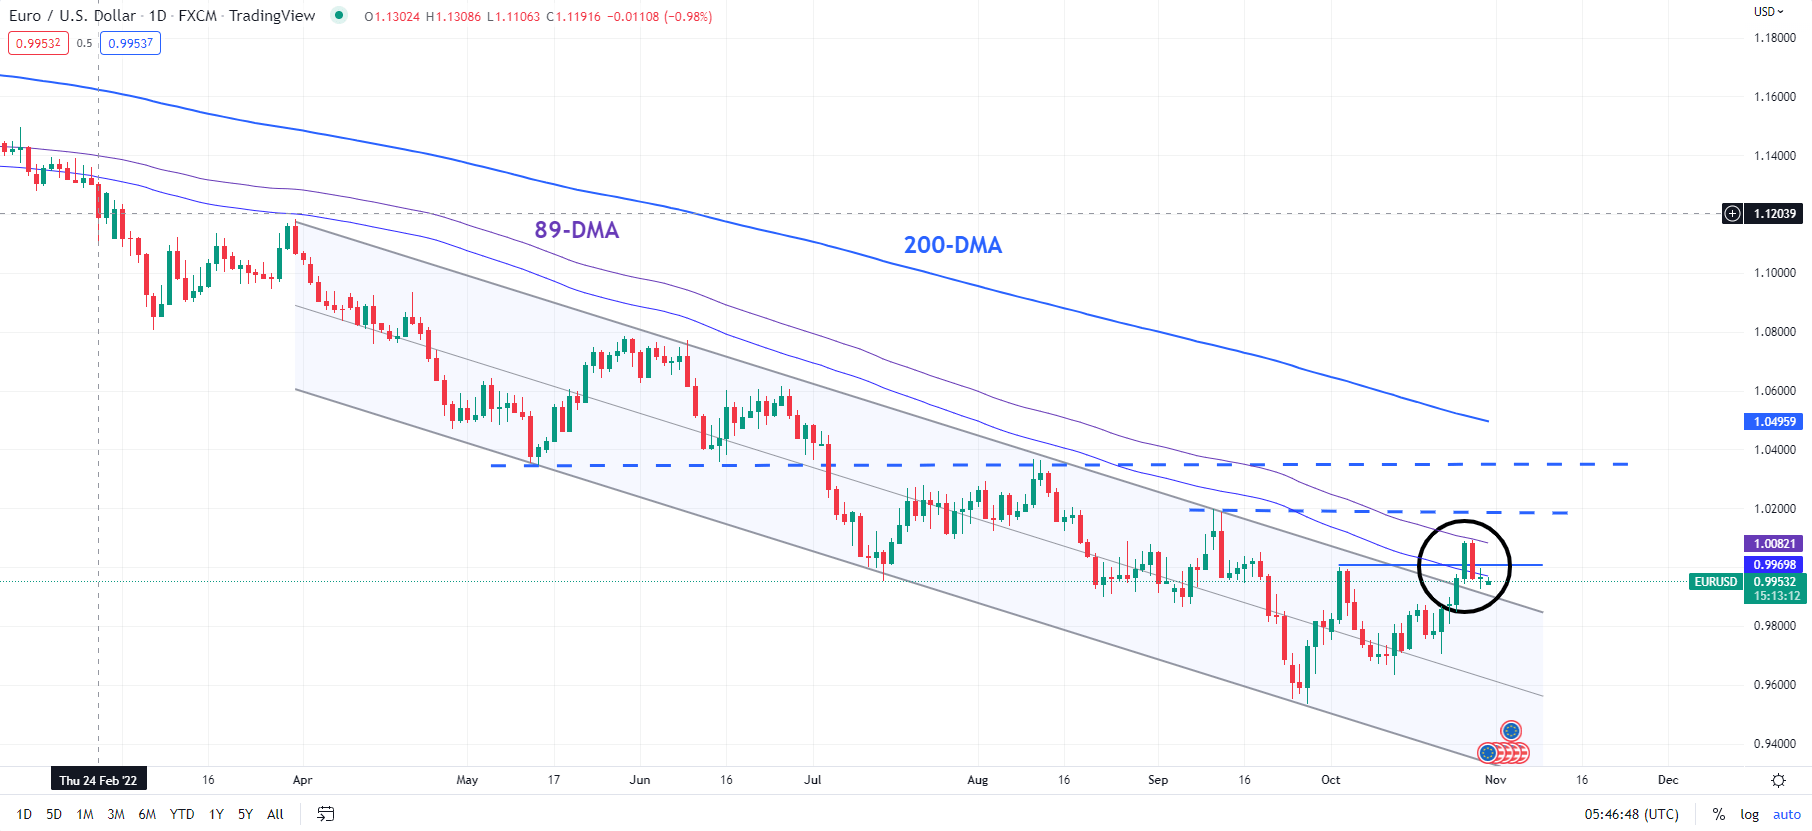
Chart Created Using TradingView
Even if EUR/USD can rise above this immediate hurdle, there is plenty of subsequent resistance that could cap the upside. This includes the mid-September high of 1.0200 and the August high of 1.0365, which coincides with the 200-day moving average.
On the downside, any break below the mid-October high of 0.9875 would be a sign that short-term upward pressure had faded, risking a drop towards the October 13 low of 0.9631.
EUR/USD Monthly Chart
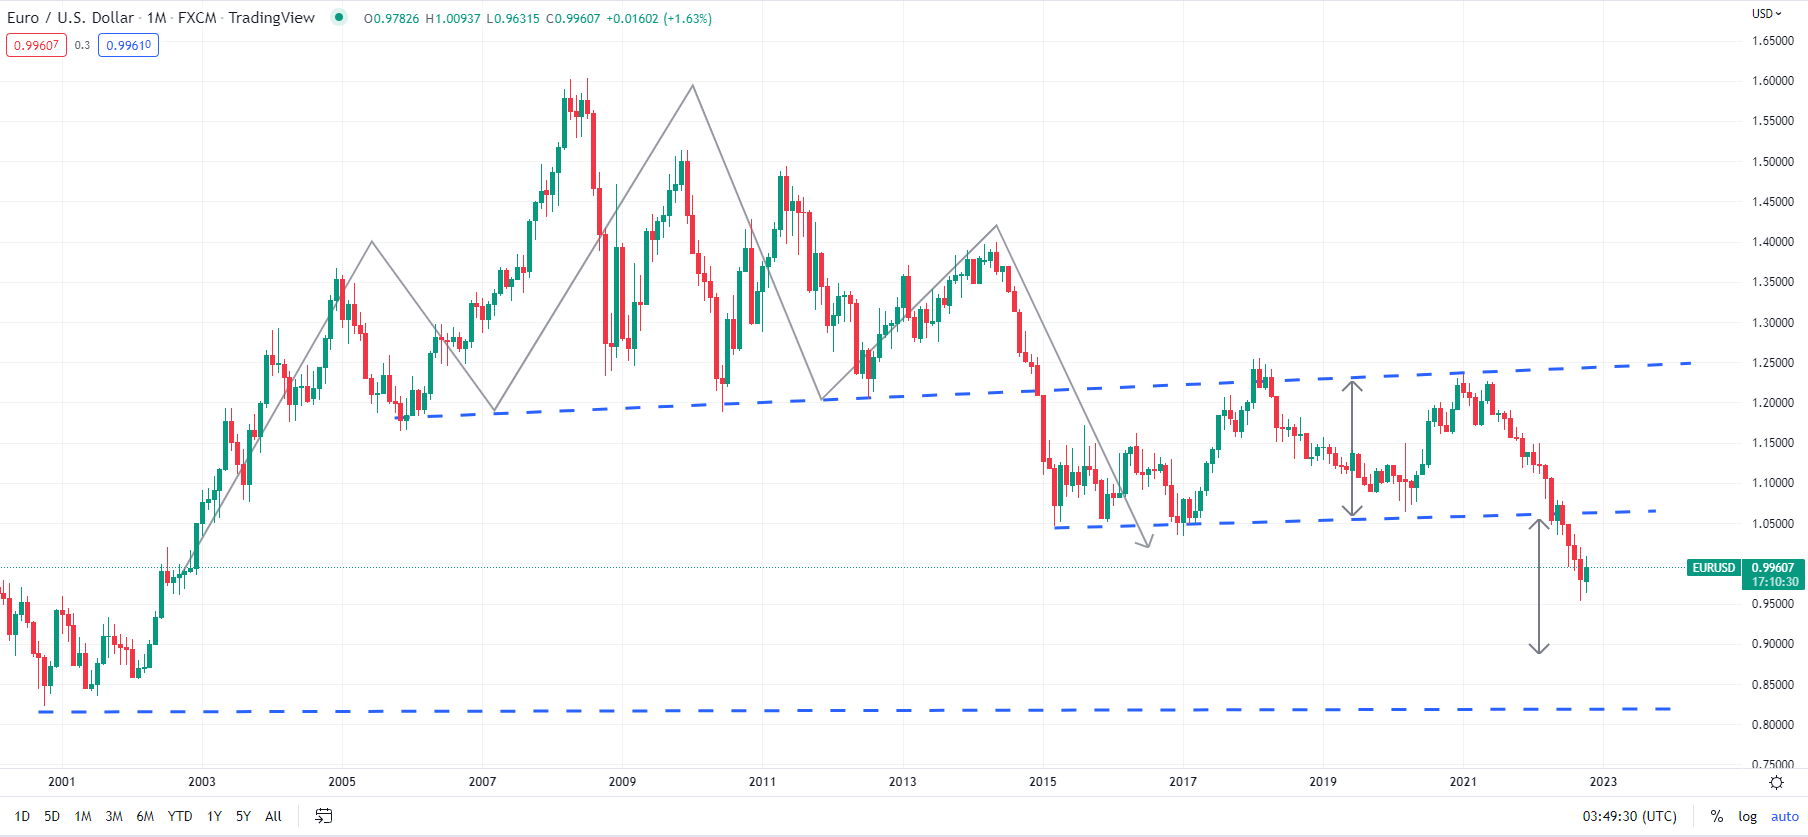
Chart Created Using TradingView
Overall, EUR/USD’s medium-term trend is down. This year’s Euro breakdown below a slightly upward-sloping trendline from 2015 points to further weakness against the Greenback in the coming weeks and months. The implied price objective following the breakout of the seven-year range works out to around 0.8900.
--- Written by Manish Jaradi, Strategist for DailyFX.com


