


US Dollar, Euro, EUR/USD - Technical Outlook:
- EUR/USD is struggling to extend gains
- Big-picture outlook remains weak for EUR/USD
- What are the key levels to watch?

EUR/USD TECHNICAL FORECAST – BEARISH
The failure of the Euro to capitalize on late-September gains against the US Dollar, coupled with the failure to break any meaningful resistance, raises the risk of a “dead-cat bounce” scenario.
On the daily chart, EUR/USD has been guided lower by a downtrend channel from April. The top end of the channel is a downtrend line that comes in at about 0.9975. The lower edge of the channel is another downtrend line that lands at 0.9415.
EUR/USD Daily Chart
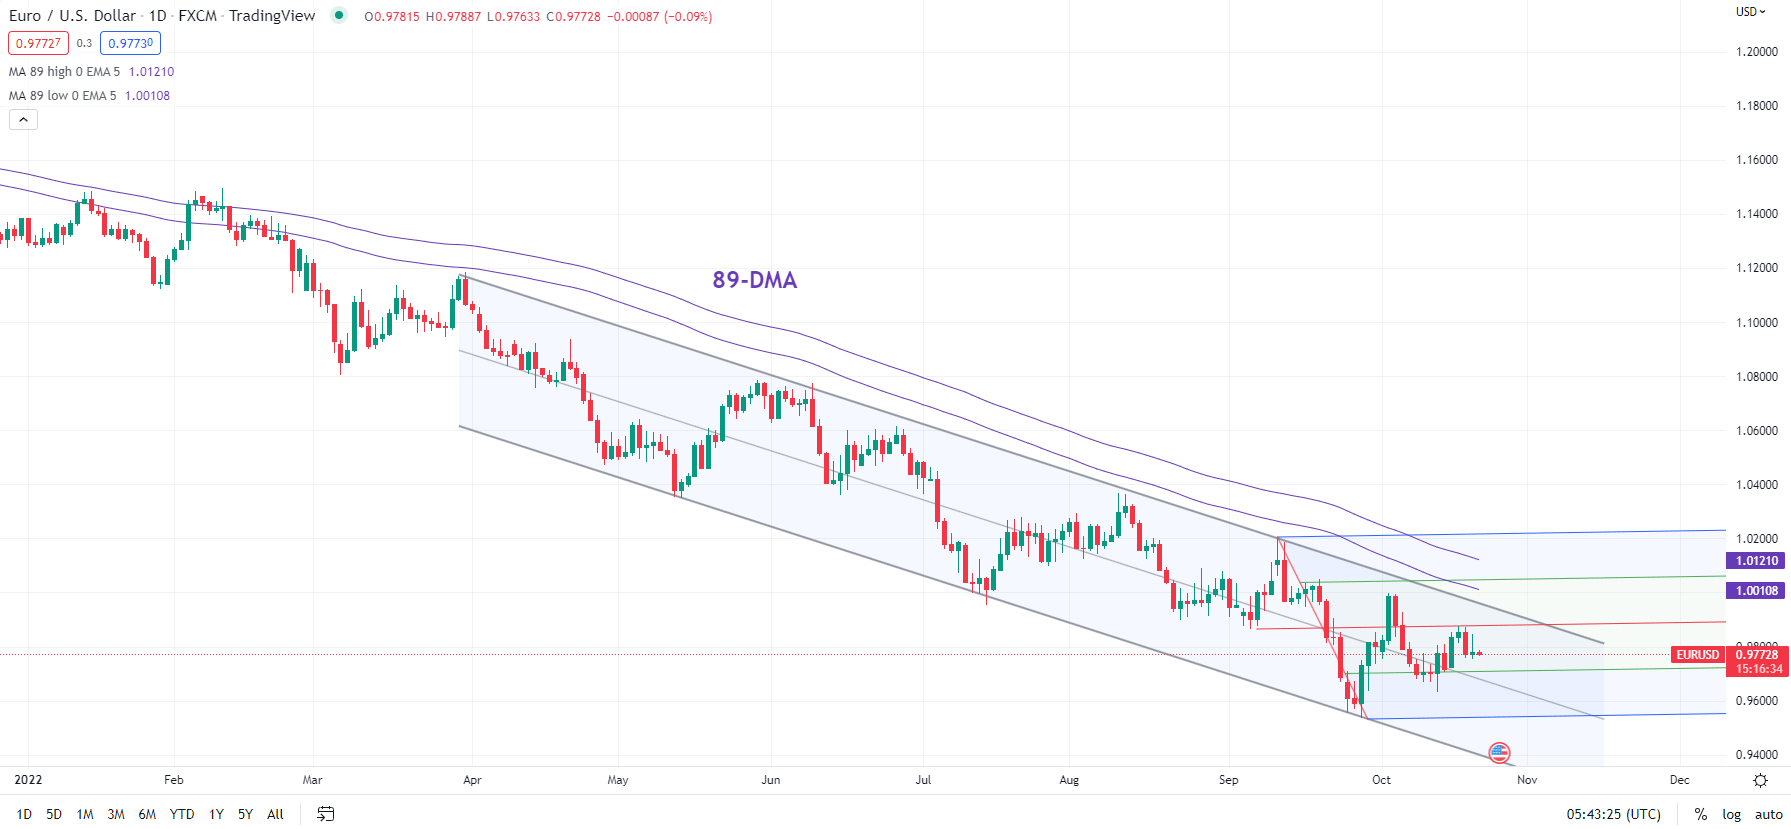
Chart Created Using TradingView
Besides the top end of the multi-month downtrend channel, the 89-day moving average (DMA) has served as solid resistance since the start of the year. Corrective EUR/USD rallies have been capped by this barrier. Hence, for any rally to be more than corrective – that is, any rise that leads to a short-term trend reversal – EUR/USD would need to decisively break above the 89-DMA.
After a few days of gains since end September, EUR/USD seems to have settled in a narrow range within a sideways channel (see chart). It has not reached the top end of this structure since April (the 89-DMA is above the top end), which itself is a sign of weakness. If a market is unable to rise to immediate resistance, then the odds of it testing secondary resistance (above the initial resistance) appear small.
EUR/USD Monthly Chart
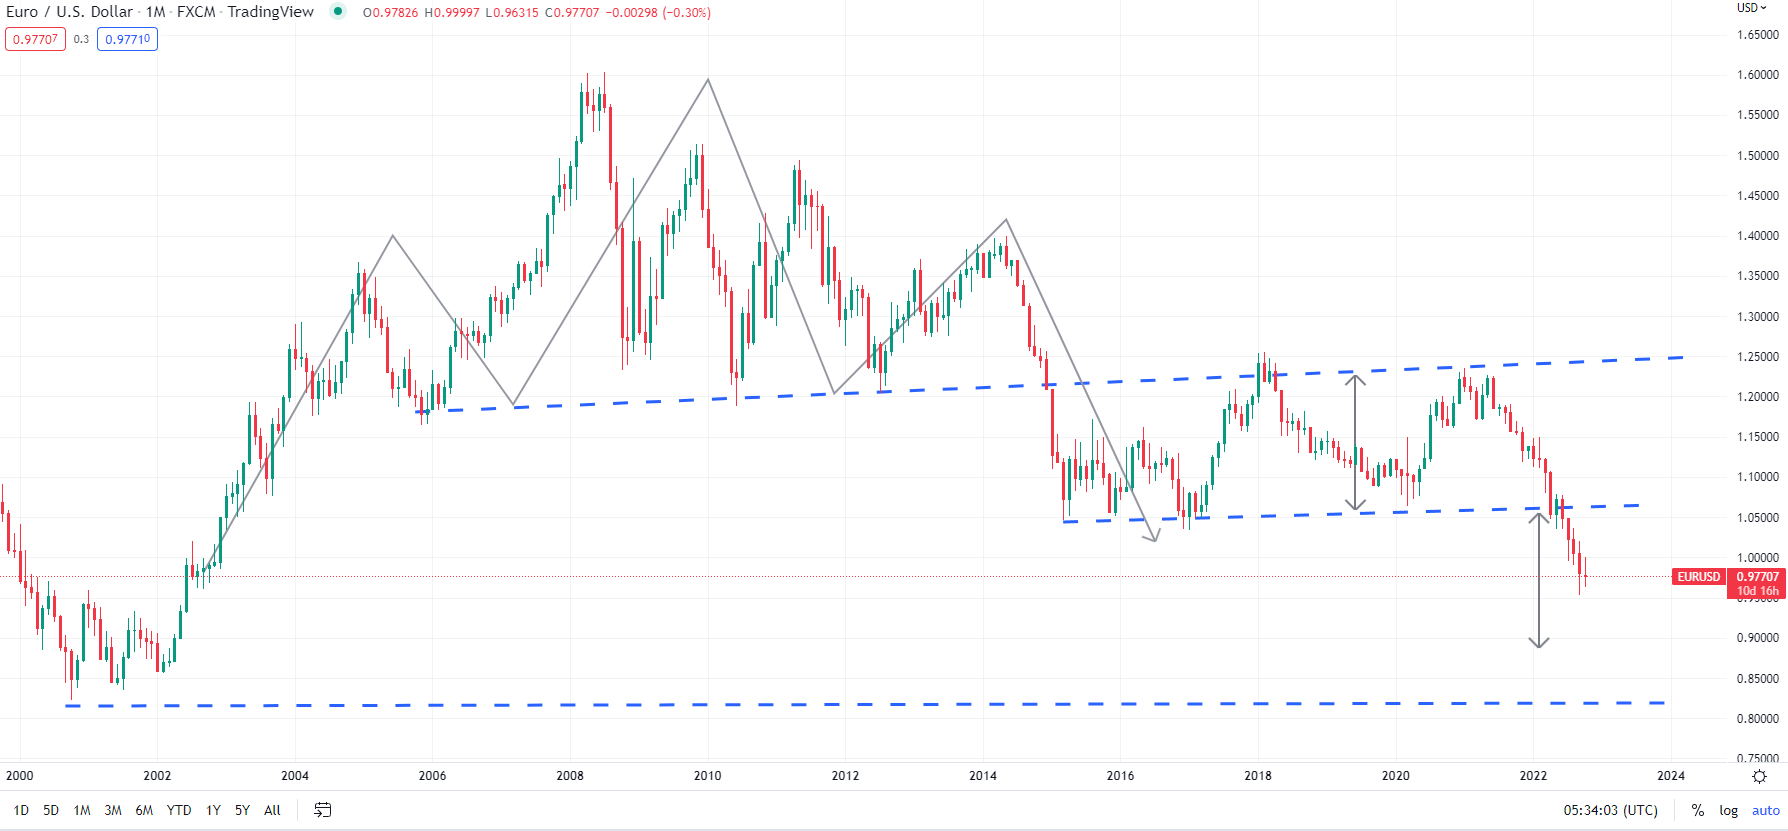
Chart Created Using TradingView
Overall, EUR/USD’s short- and medium-term bias remains bearish. Looking to the longer term, the single currency’s break this year below a slightly upward sloping trendline from 2015 against the Greenback points to further weakness in the coming weeks and months. The price objective following the breakout of the seven-year sideway range works out to be around 0.8900. The next significant support comes in at the 2000 low of 0.8225. However, immediate support is at the September bottom of 0.9535, followed by the lower end of the channel from April.

--- Written by Manish Jaradi, Strategist for DailyFX.com


