


S&P 500
The S&P 500 has enjoyed a phenomenal start to 2024 with the benchmark index achieving a return in excess of 10% year-to-date so far. The outright gain of the index is less impressive than the sheer persistence of the move in the face of elevated interest rates and numerous warnings about weaker growth and even recession. The move has been characterized by the distinct lack of pullbacks, apart from a few very shallow pullbacks that failed to deter bullish sentiment.
We head into Q2 with very little (technically) that suggests the bull trend may reverse or even fatigue. The narrow ascending channel bears testament to the one-directional move, as price action heads up and to the right with few challenges. The S&P 500, like the other indices analysed in this forecast, achieved multiple all-time highs in Q1 and therefore has plenty of clean air ahead as it charts a new course.
The lack of reference points presents a challenge for technical forecasting which is where the 161.8% Fibonacci level (corresponding to the major 2022 decline) provides a useful indication for upside potential at 5640. Essentially, prices have more than overcome the 2022 decline, so much so that we now look ahead to the potential for prices to rise more than one and a half times higher than the original reference point in early 2022.
The downside becomes a little easier to evaluate however. Shallow pullbacks have provided short-lived levels where horizontal rays can be drawn – denoting potential downside tripwires. Since the index is yet to undergo a proper pullback, levels at 5057 and 4918 are areas to watch if bears start to gain confidence and bulls potentially reduce exposure. Thereafter, the 4818 level (prior all-time-high) would naturally appear as the next level of support.
It is difficult to imagine the index maintaining this pace into Q2 and perhaps the path of US stocks is more likely to decelerate to a more moderate upward trajectory.
S&P 500 Weekly Chart
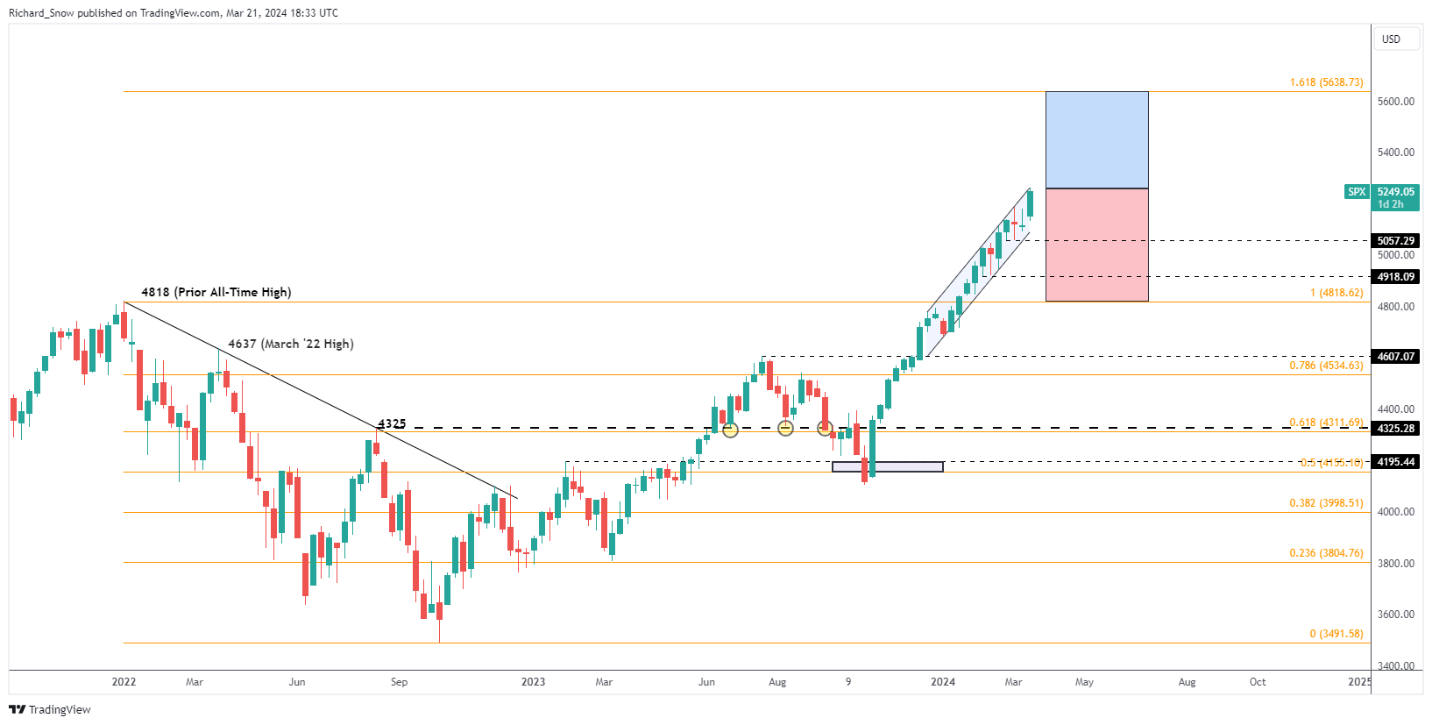
Source: Tradingview, Prepared by Richard Snow
After developing a thorough understanding of the technical setups, why not download the complete Q2 forecast for US equities for the full picture?

Nasdaq 100
The Nasdaq 100 has also performed well in Q1, rising 8.88% at the time of writing (pink dotted line). While the magnificent seven stocks (shown below) have been massive outperformers in the past, Nvidia stands head and shoulders above the rest, seeing nearly 80% growth in Q1 alone. Meta has also appreciated this year, rising around 40% since the turn of the new year.
Others have found the going tough, like Tesla with its declining Chinese sales and Apple with its numerous lawsuits.
Nasdaq 100 Index (pink line) and Magnificent Seven Stock Performance Year-to-Date
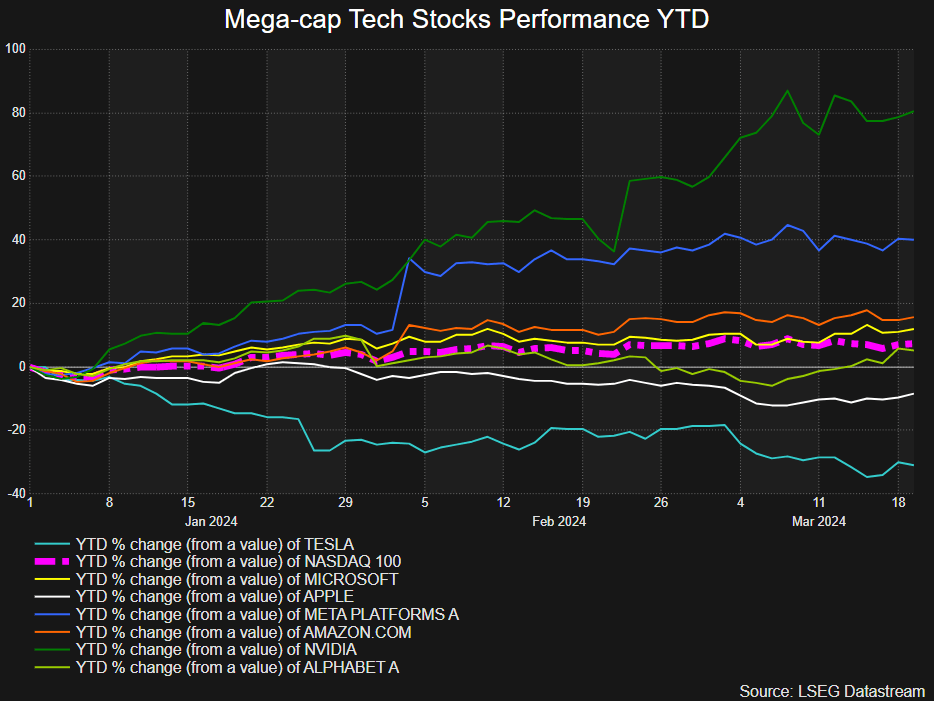
Source: Refinitiv Datastream, Prepared by Richard Snow
The tech-heavy Nasdaq has also traded to a new all-time high in 2024, however, it has appeared less bullish than the S&P 500 in recent weeks. The high around 18,460 has been approached twice without the necessary momentum to break above it. Far from a bearish signal, the weekly candles do appear to suggest another catalyst may be needed to break new ground for the index.
Adopting the same 161.8% Fibonacci projection as that applied to the S&P 500, the upside marker appears more of a challenge – providing a positive reward/risk profile for Q2 if the bullish trend continues in the same way it ended Q1.
Since we are in new territory (new all-time high), the challenge is to find appropriate upside levels of consideration which is frought with uncertainty. Pullbacks have also proven to be shallow and little else other than recent price actions suggests the bullish trend is likely to come under immediate pressure.
Nevertheless, if weakness or profit taking becomes widespread, the first tripwire for a deeper pullback emerges at 17,764 with the 16,764 marker something to be cognizant of. A continued move below 16,764 ought to be enough to reconsider the longevity of the bullish trend.
Nasdaq 100 Weekly Chart
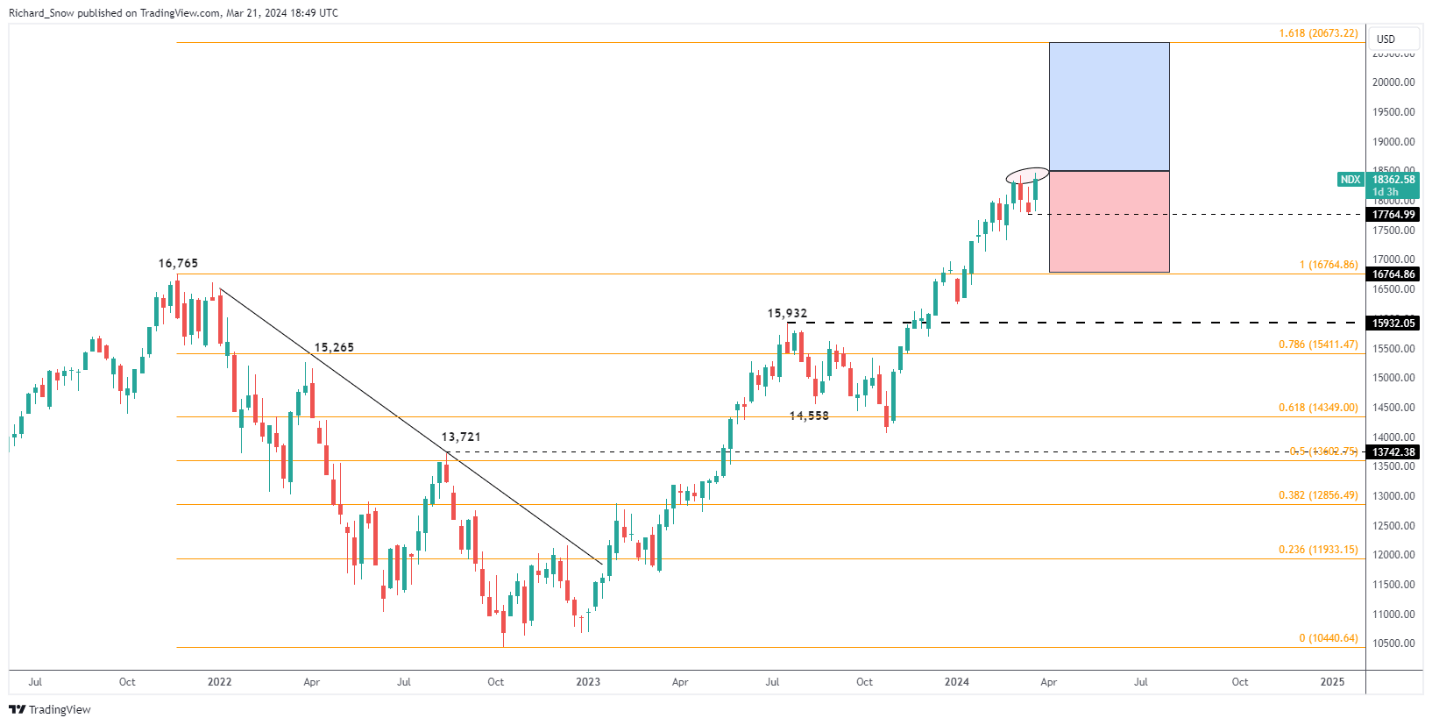
Source: Tradingview, Prepared by Richard Snow
Looking for actionable trading ideas? Download our top trading opportunities guide packed with insightful tips for the second quarter!

Dow Jones (DJI)
The Dow comprises of only 30, large blue-chip stocks thought to be representative of the US economy and has produced perhaps the strongest finish to Q1 of all the other indices analysed. The index is price-weighted as opposed to market-cap weighted meaning larger swings in price have more sway on the smaller index than the actual size of the company in terms of market cap.
The Dow witnessed a steeper ascent in the latter months of 2023 than what we saw in Q1, which suggests in Q2 we could possibly see a further flattening of the uptrend but an uptrend nonetheless.
The 161.8% Fibonacci level sits a little over the 42,000 mark, with a retest of the prior all-time high of 36,952 a little further away than the upside target.
Dow Jones Industrial Average Weekly Chart
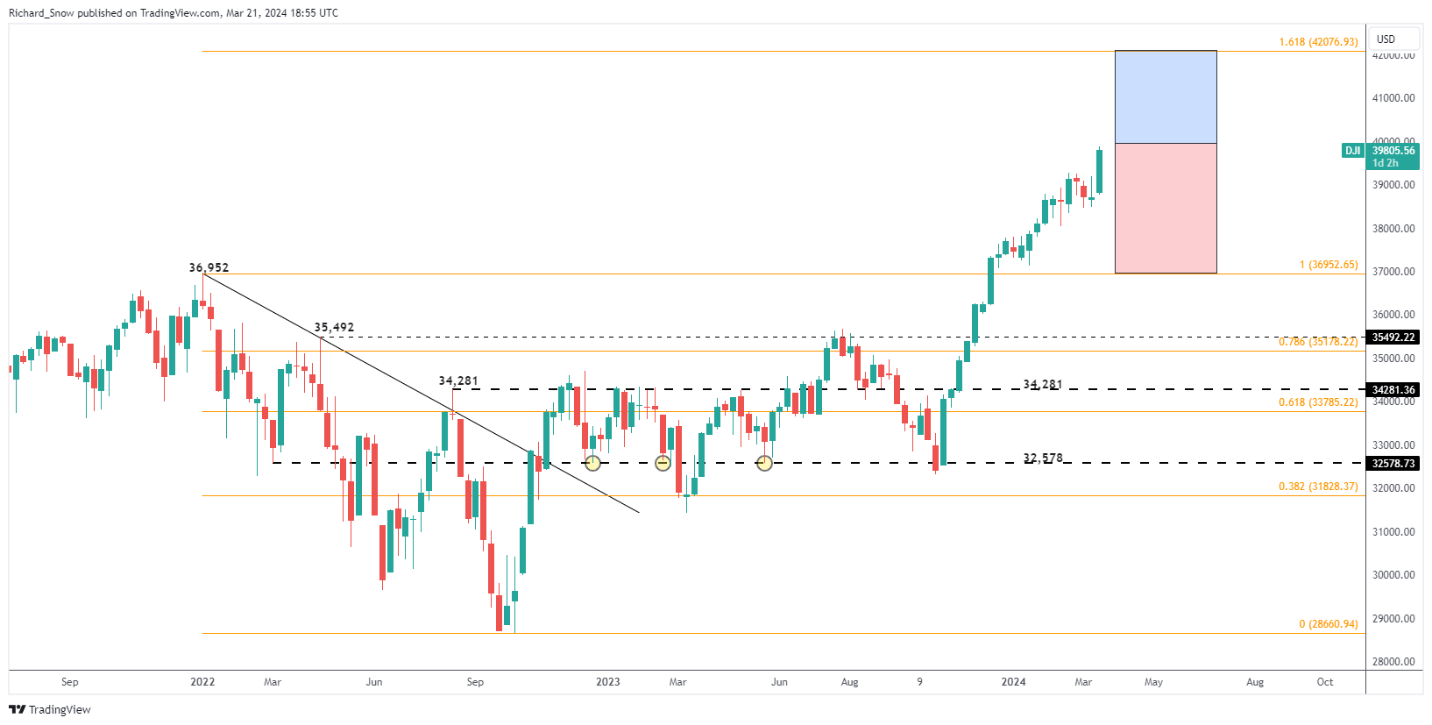
Source: Tradingview, Prepared by Richard Snow


