


Dow Jones, Crude Oil, Retail Trader Positioning, Technical Analysis – IGCS Update
- Dow Jones and crude oil prices have been falling recently
- Retail traders responded by boosting net-long exposure
- Is this a sign that further losses could be in store ahead?

In recent days, the Dow Jones and crude oil have been aiming lower. This followed hawkish testimony from Federal Reserve Chair Jerome Powell. In response, retail traders have increased their upside exposure in these assets. This can be seen by looking at IG Client Sentiment (IGCS), which tends to function as a contrarian indicator. With that in mind, could further pain be in store for these assets?
Dow Jones Sentiment Outlook - Bearish
According to IGCS, about 56% of retail traders are net-long the Dow Jones. Since most traders are net-long, this hints that prices may continue falling. This is as downside exposure decreased by 8.45% and 4.68%, respectively. With that in mind, the combination of overall positioning and recent changes is producing a stronger bearish contrarian trading bias.

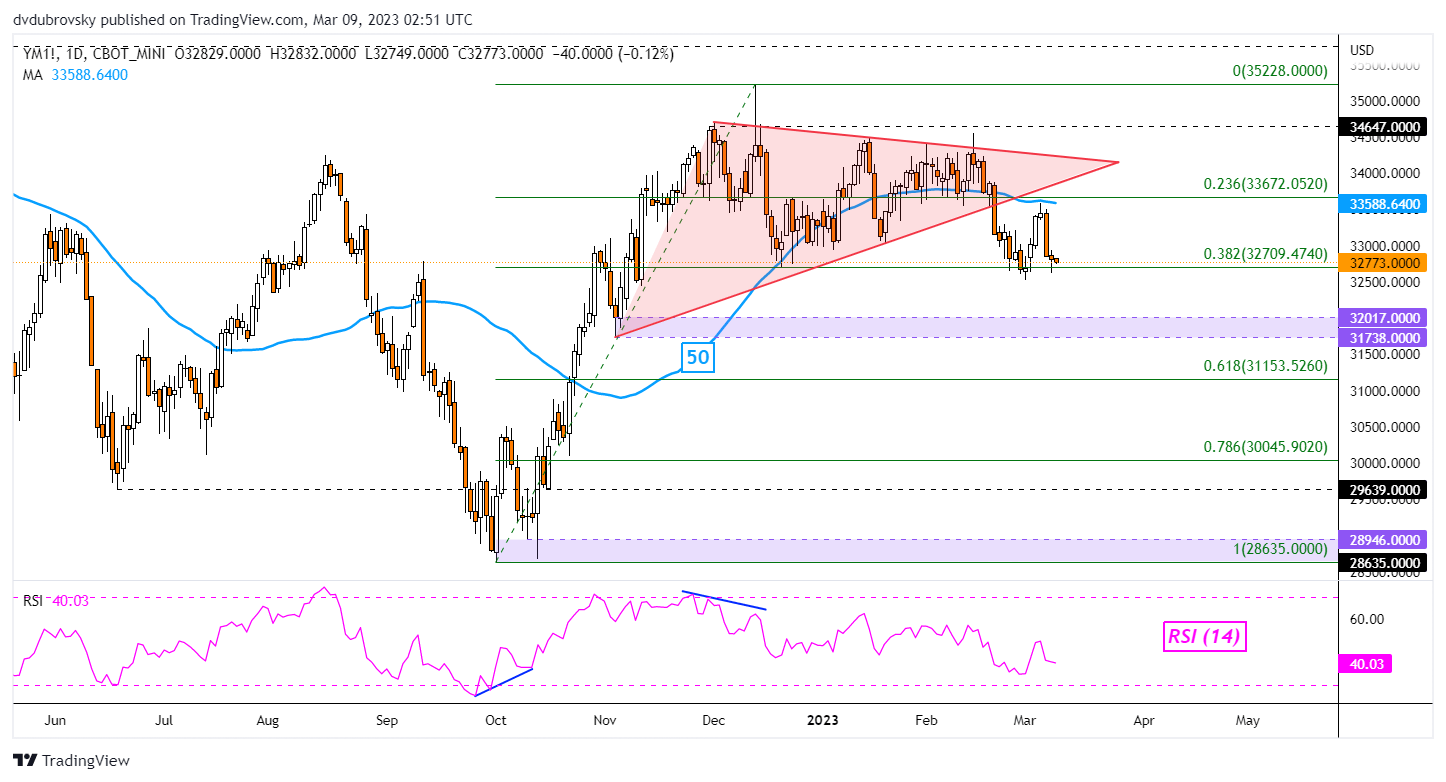
Dow Jones Futures Technical Analysis
On the daily chart, the Dow Jones was unable to hold a close under the 38.2% Fibonacci retracement level at 32709. This has further reinforced the area around this price as kye support. Confirming a breakout under this point exposes the 31738 – 32017 support zone. This range could be targeted given the bearish implications of the Symmetrical Triangle breakout from late February. Immediate resistance seems to be the 50-day Simple Moving Average (SMA).
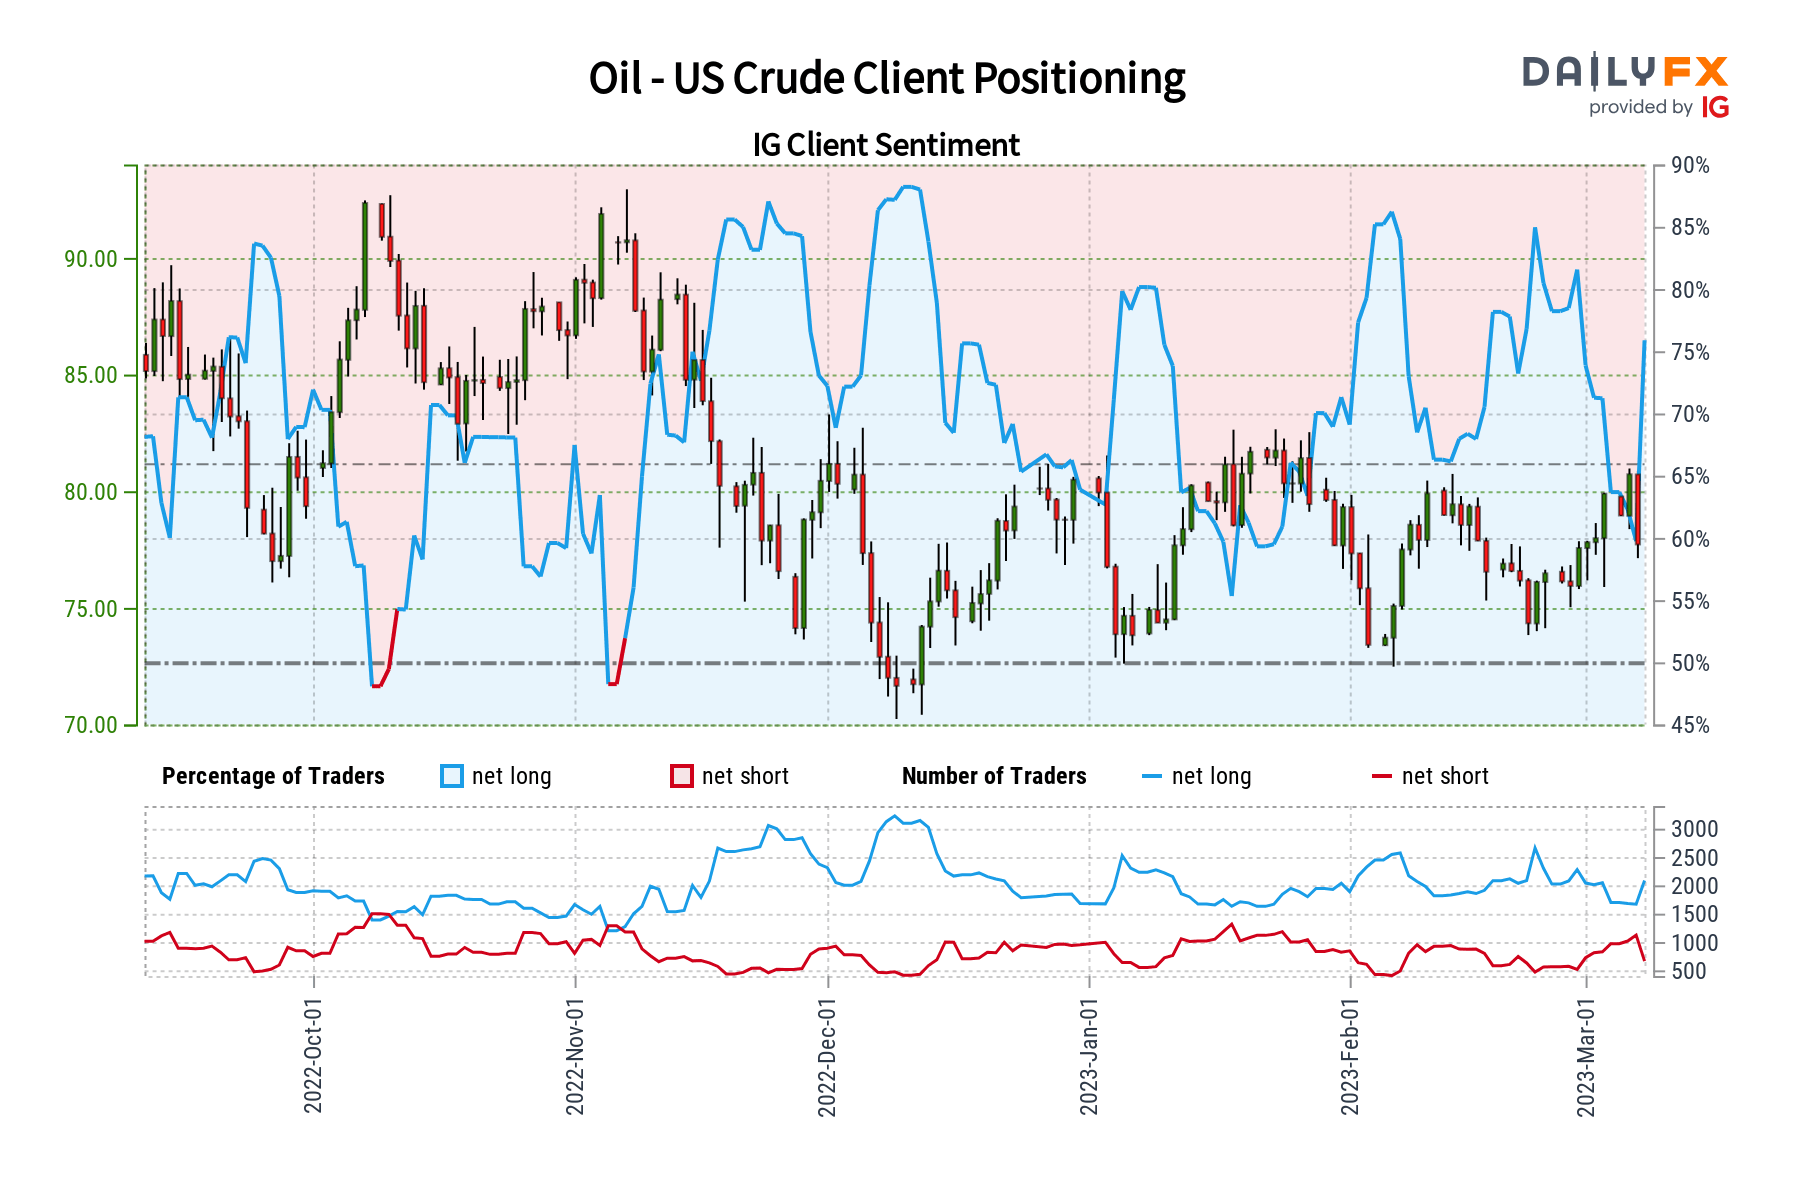
Crude Oil Sentiment Outlook - Bearish
According to IGCS, about 78% of retail traders are net-long crude oil. Since most traders are biased to the upside, this hints that prices may continue falling. This is as upside exposure increased by 16.71% and 3.58%, respectively. With that in mind, the combination of current sentiment and recent changes is offering a stronger bearish contrarian trading bias.

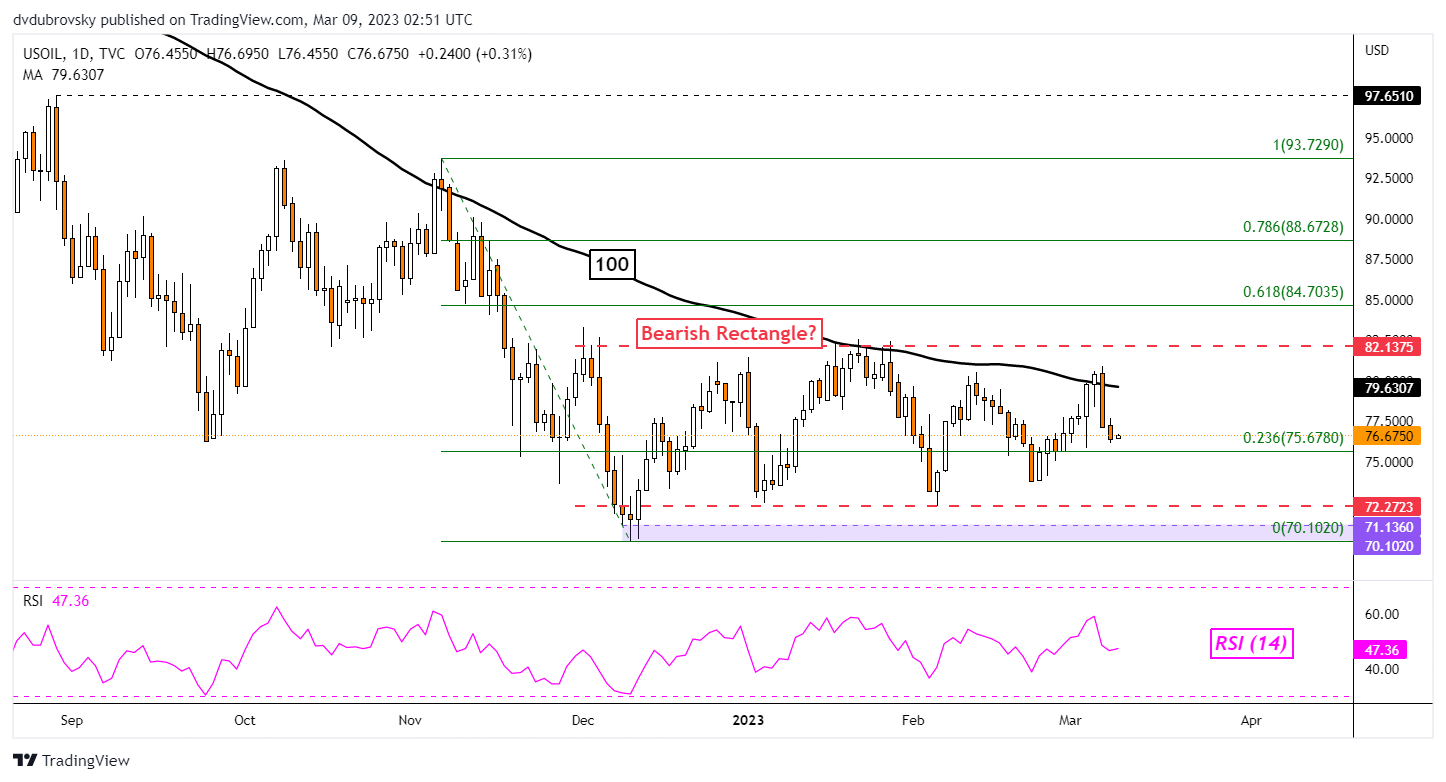
WTI Technical Analysis
WTI crude oil has been trading lower in recent days within the boundaries of a potential Bearish Rectangle chart formation. The ceiling seems to be around 82.13 with the floor near 72.27. This is as the 100-day SMA recently held as resistance, maintaining the broader downside focus. Immediate support seems to be the 23.6% Fibonacci retracement level at 75.67. Clearing the latter exposes the rectangle’s floor.
--- Written by Daniel Dubrovsky, Senior Strategist for DailyFX.com
To contact Daniel, follow him on Twitter:@ddubrovskyFX


