Dow Jones, CAC 40, and Nikkei 225 - Prices, Charts, and Analysis
Download your free copy of the Q2 Equities Forecast today and gain the insights you need to make informed trading decisions.

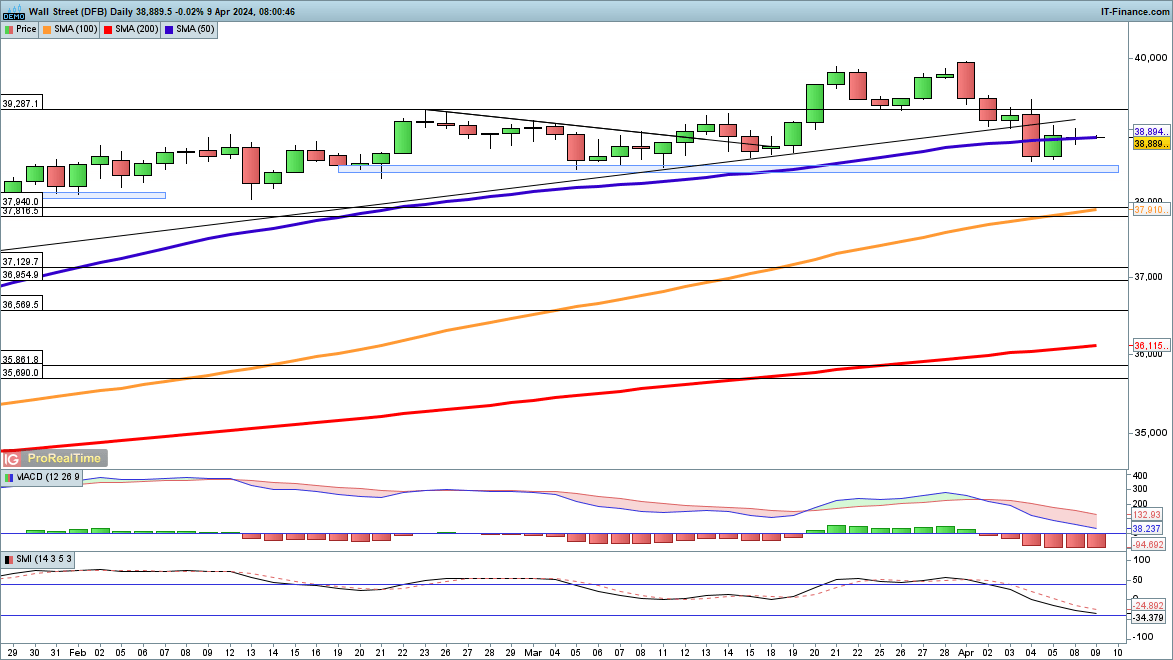
Dow stabilises on a quiet day
The index slumped last week but saw buyers on Friday in the wake of the payrolls report. A quiet session on Monday saw little movement, but crucially buyers have been able to prevent any further short-term downside.A close back above 39,000 could help suggest that a low is in place, and might then result in a push towards 40,000.
39,500 has acted as an area of support since mid-February, so a close below this could mark the start of more short-term weakness.
Dow Jones Daily Chart
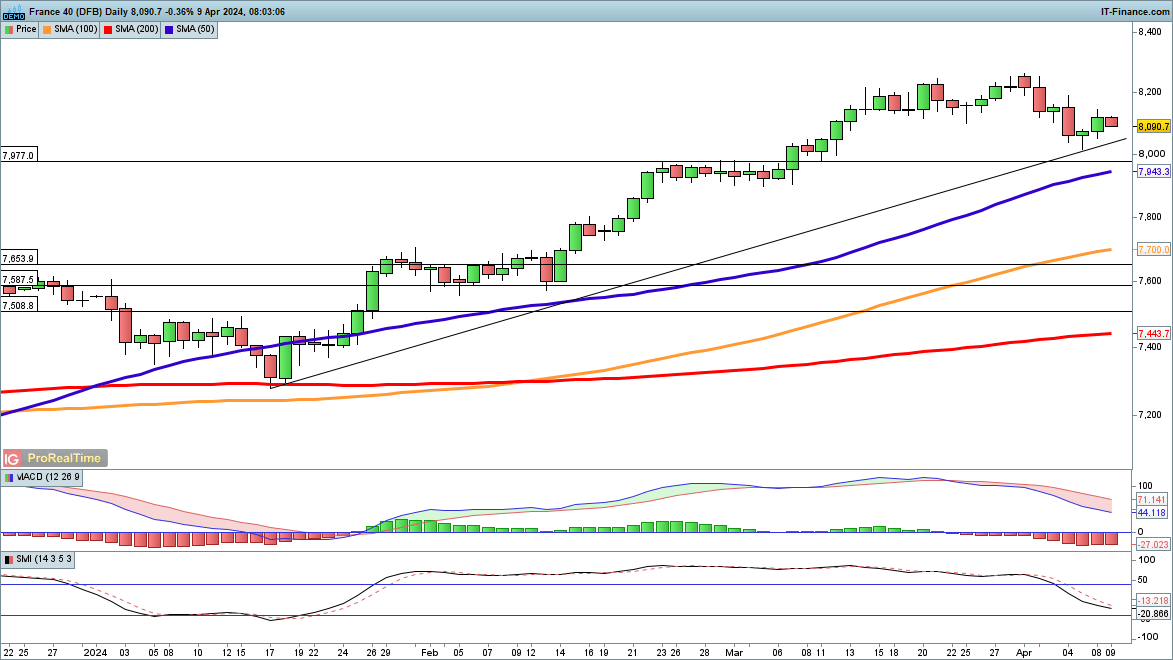
CAC 40 looks for further gains
Friday and Monday saw the index recover after dropping back at the end of March. A higher low appears to have been created and remains in place unless the price can manage a close back below 8000 and below the previous highs around 7977.
Additional gains would target the highs from the end of March at 8260.
CAC 40 Daily Chart
Market sentiment shifting? Our exclusive data gives you the edge. Make informed trades with confidence.
| Change in | Longs | Shorts | OI |
| Daily | 74% | -11% | 6% |
| Weekly | 32% | -5% | 5% |
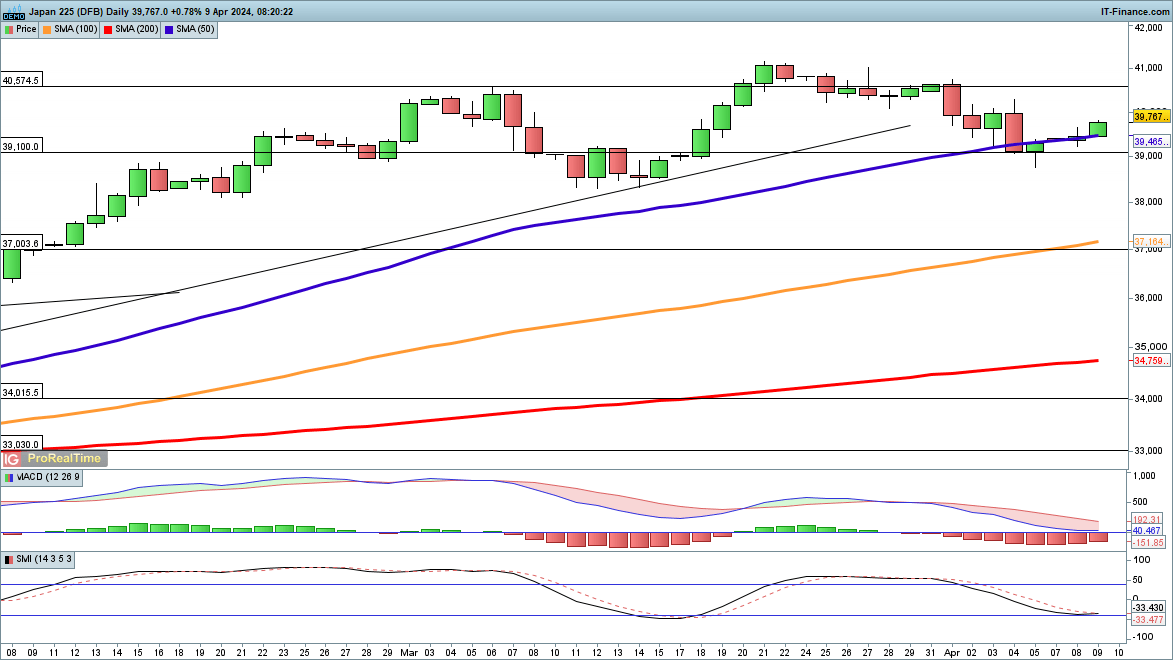
Nikkei 225 heads higher
After bottoming out last week the index has made further gains, opening above the 50-day simple moving average (SMA).Additional upside would see the price head towards the March highs at 41,160, while above this the price will move into new record high territory.
A higher low has been created, maintaining the bullish view, and it would need a close below 38,760, last week’s lows, to open the way to the early March lows at 38,280.
Nikkei 225 Daily Chart