


US Dollar, USDJPY, EURUSD and GBPUSD Technical Forecast Talking Points:
- The DXY Dollar Index closed below its 200-day simple moving average for the first time in 380 trading days this past week – ending a record run above the trailing measure
- USDJPY has been the slowest to retreat among the majors and from the highest starting point with one critical break putting us into conflict with further significant support
- Both EURUSD and GBPUSD have advanced to five month highs, but they now face the technical midpoints of significant ranges

Technical Forecast for the US Dollar: Bearish
The Dollar has retreated approximately 9 percent from the multi-decade highs it set back in late-September. While this could still prove a period of moderation before the prevailing trend regains traction, it is gaining greater traction towards shifting the dominant trend to one that is bearish. Adding to this flip in underlying current are the progressive technical support levels that are giving way in aggregate and among key crosses. Looking to the DXY Dollar Index, the CPI-spurred break of the 2022 trendline support and 100-day moving average up around 109.50/00 was the first salvo. That was a high-profile chart move which would be difficult to miss by even the most casual observer. This past week, a subsequent bearish milestone was passed when the Dollar dropped below the 200-day moving average for the first time in 380 trading days. That broke the longest spell of price action above that high profile technical indicator on record. At the close of this past week, the markets were still wrestling with the conviction of a break below the midpoint of the 2022 range. It looks to neither support bulls nor bears. Further technical levels to consider below include the December 2016 high around 113.80; the March 2020 pandemic high of 103.00 and the 61.8% Fib retracement of the past two decade’s range (2001 high to 2008 low) at 101.80.
Chart of DXY Dollar Index with 100 and 200-Day SMAs (Daily)
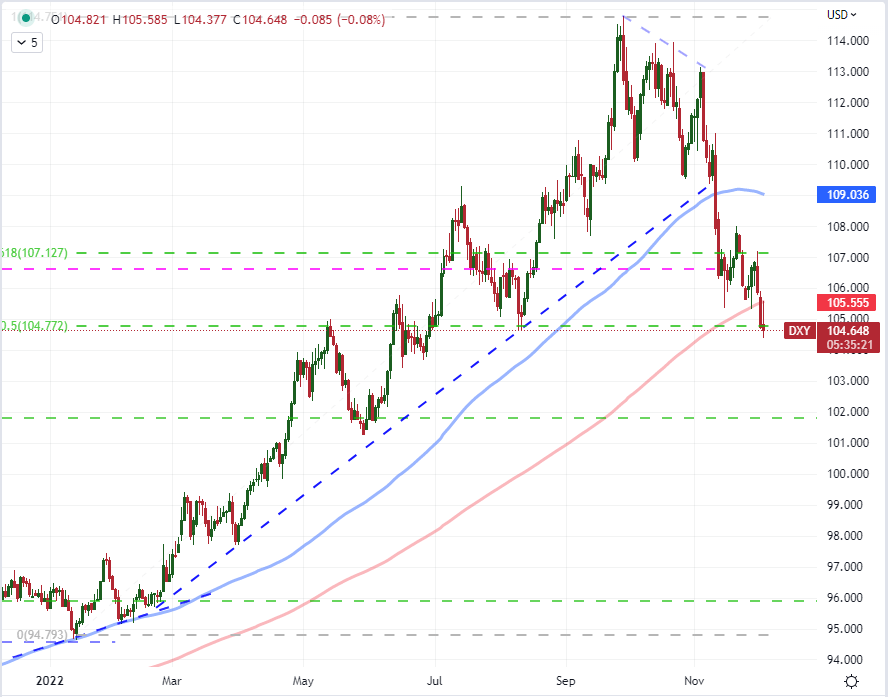
Chart Created on Tradingview Platform
While the DXY has fewer critical technical support levels to suggest there could be a serious constraint on momentum next week, there are quite a few among the major crosses. Perhaps one of the most impressive of the Dollar pairs is USDJPY which has reversed -11 percent from its failed break above 150 back six weeks ago. The break of 145 was the critical first step to break the persistent moment that cofounded Japanese policy authorities. However, it was this past week’s second leg lower below 137.50 which suggested there was more than a violent retracement. Through Friday’s close, the pair was wrestling with confluence of critical technical support founded between the previous multi-decade swing high set on January 2002 at 135.16; the 38.2% Fib of the April 2021 to October 2022 run higher at 135.05 and the 200-day SMA near 134.90. Should this rough floor give way, attention will build with further technical supports pulling from previous swing lows that were used as stepping stones higher during the 2022 rally (eg 130.40 and 126.40).
| Change in | Longs | Shorts | OI |
| Daily | -2% | 2% | 0% |
| Weekly | 12% | -16% | -6% |
Chart of USDJPY with 200-Day SMA and 20-Day Rate of Change (Daily)
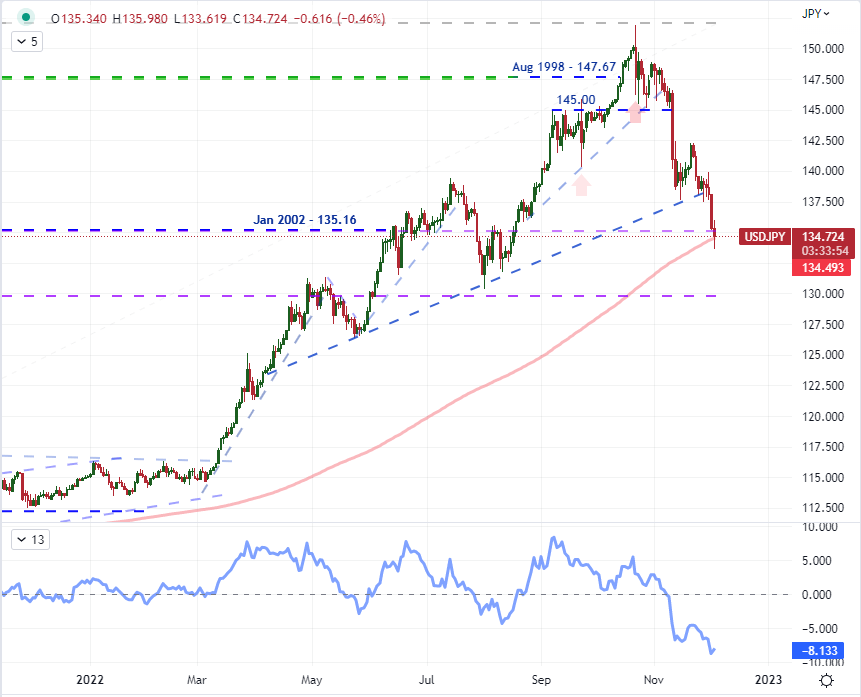
Chart Created on Tradingview Platform
Similar to USDJPY (yet mirrored considering the Dollar is on the opposite side of the pair), EURUSD has been making choppy but critical progress. The break a month ago above 1.0100 led to a quick rally back to the 1.0350 pivot level whereby the market essentially leveled out for chop for weeks. The presence of the 200-day moving average was a general constraint, but it was clearly not holding the market back as if a critical line in the sand as we oscillated around the technical measure. That back and forth erodes the perception of its ultimate influence on the market. From the jump next week, the midpoint of the January 1.1500 high to September decades low at 0.9540 at 1.0520 will play the starting point for the markets next move. There are further levels above, but they are further back and thin out due to how progressive the decline has been this year. I will be watching the previous pandemic swing low around 1.0640, but I will also be monitoring momentum. The blue line in these Dollar majors charts are the 20-day rate of change; and in each instance, they have hit multi-year levels of intensity relative to the Dollar’s decline. For EURUSD, the tempo has charged to heights not seen since October of 2010. That could signal exhaustion – but that doesn’t necessarily mean a reversal of trend. It could translate into a more moderate clip of climb ahead.
| Change in | Longs | Shorts | OI |
| Daily | -1% | -4% | -3% |
| Weekly | 4% | -10% | -5% |
Chart of EURUSD with 200-Day SMA and 20-Day Rate of Change (Daily)
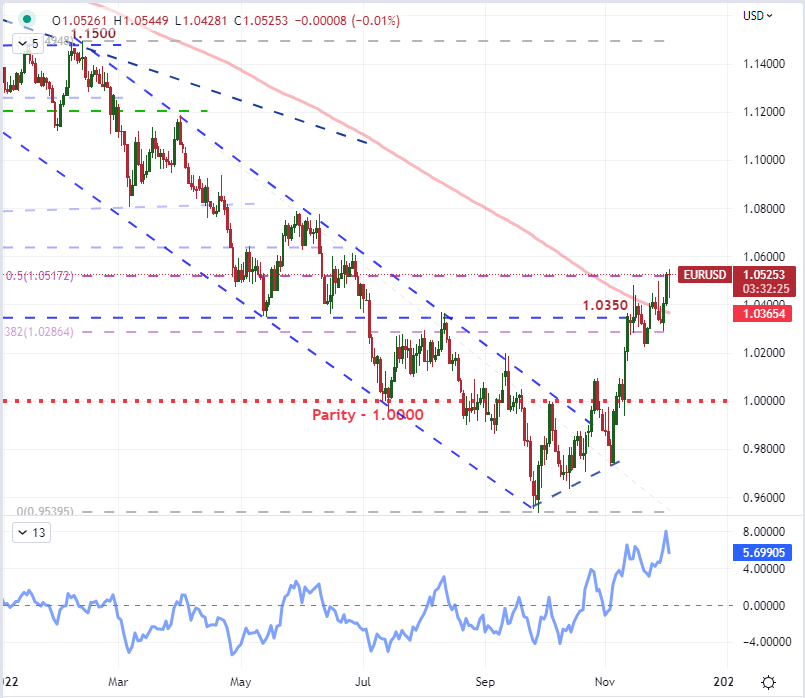
Chart Created on Tradingview Platform
As remarkable as the EURUSD’s 20-day rate of change is, GBPUSD’s is even more extraordinary. We have to stretch all the way back to the turn from the Great Financial Crisis back in May 2009 to find a comparably aggressive move higher from the Cable. The Sterling’s slump in September/October no doubt added to the intensity of the snap back, but it is nevertheless a remarkable stretch which should be monitored for signs of unwind. For GBPUSD, the same progressions have been seen this past week. We just crossed back above the 200-day SMA for the first time in 318 trading days and Friday’s post-NFP stab lower seemed to hold up the former resistance as new support. Where the Fib levels on the other crosses have been prodded on the other crosses, the Cable seemed to respect the distinct midpoint of its own May 2021 to September 2022 bear wave at a relative flat 1.2300. Consider there was some similar technical precedence in treating this same level as resistance between June and August, there may be greater awareness to its influence.
| Change in | Longs | Shorts | OI |
| Daily | 3% | -7% | -3% |
| Weekly | 4% | -10% | -5% |
Chart of GBPUSD with 200-Day SMA and 20-Day Rate of Change (Daily)
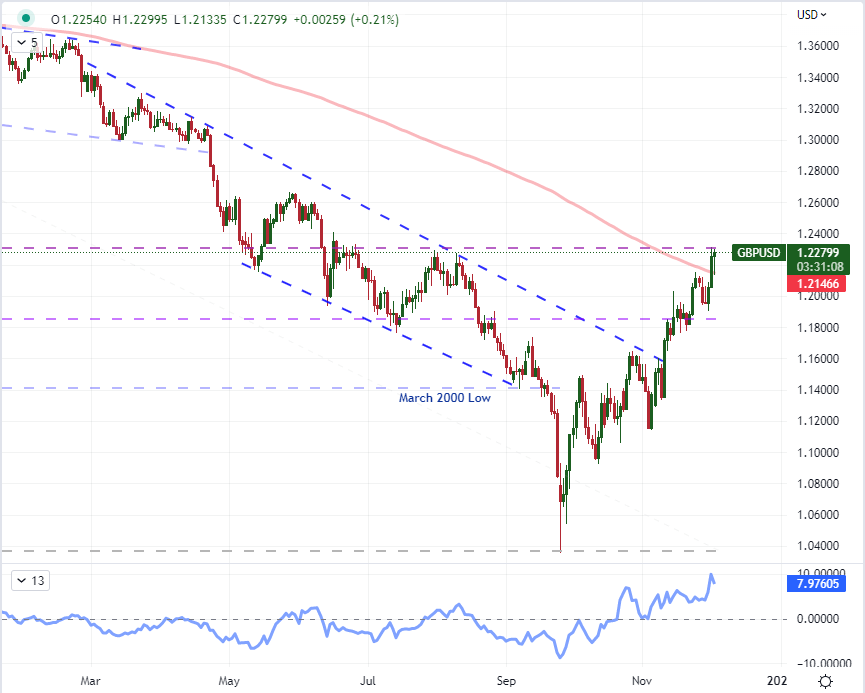
Chart Created on Tradingview Platform


