


US Dollar, EURUSD, USDJPY and NZDUSD Technical Forecast Talking Points:
- Since the larger trend channel breakdown from the DXY Dollar Index back on December 10th, the Greenback has been working its way into a distinct descending wedge
- A break is likely for the Dollar and some of its key crosses – but it doesn’t have to be a break based on conviction, especially given holiday liquidity expectations
- EURUSD is in a technical position to break in either direction while USDJPY and NZDUSD are already in various stages of progress

Technical Forecast for the US Dollar: Bullish
The Dollar will open the new week in a precarious technical position. Despite the fireworks from event risk like the FOMC rate decision, November CPI and December PMIs; the Greenback failed to make a resolute technical break from a prominent technical pattern. While there has been some further bearish retreat from the DXY Dollar Index since its impressive bullish channel breakdown back on November 10th, the progress it has made has been noticeably decelerating. That condition has translated into a very prominent descending triangle – too steep for me to be considered a pennant pattern. Such a state of technical wind up would normally be a focus for me as I waited for the market to make its break, either bullish or bearish. Then I would look to establish whether the break was merely one of ‘necessity’ whereby we simply ran out of room to maneuver or ‘conviction’ which insinuates an ability to find follow through. Rate speculation could play a role here given how strong the correlation has been between DXY and forecasts for the Fed Funds outlook through 2023 (below), but that may not find traction either. Momentum heading into these final two weeks of the year would be the exception to the rule, but that doesn’t mean we should write it off.
Chart of DXY Index with 100-Day SMA Overlaid with Fed Rate Forecast Through End 2023 (Daily)
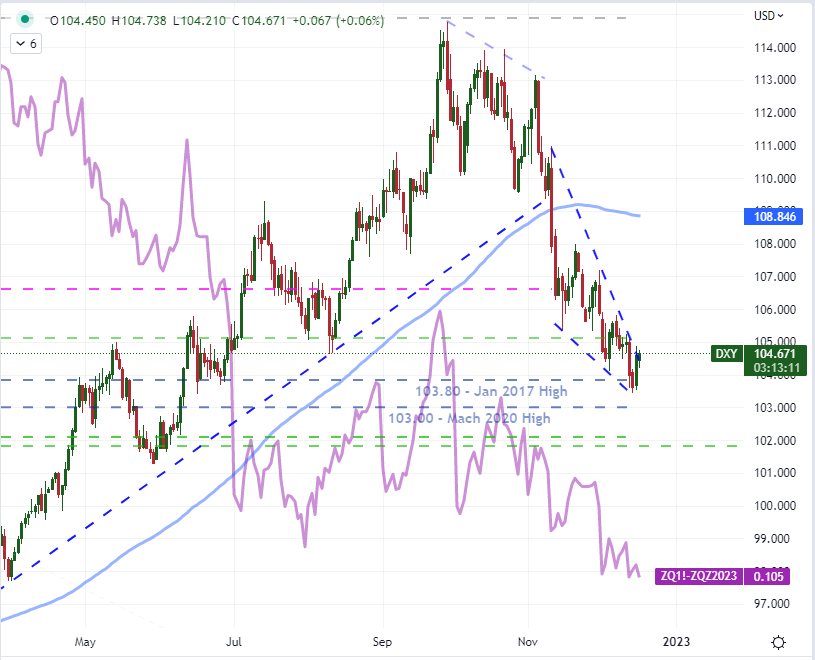
Chart Created on Tradingview Platform
With the uncertain backdrop between market direction and depth, I’m looking for USD pairings that look primed for different outcomes. Given that the ICE’s DXY index is principally EURUSD, it makes sense that the benchmark pair’s chart looks like a mirror of the aggregate (the Dollar is the ‘quote currency’). That said, the 4-hour EURUSD chart brings the rising wedge into sharper focus. Depending on where you pull the series of lows for the pattern, it can seem that we are close to breaking the lower bound or have already done so. It would be a stretch to say there is a clear head-and-shoulders pattern on the pair from Tuesday through Friday of last week, but it fits the spirit of the move. With a gap in liquidity, the speculative gravity to follow the ‘neckline’ break will be disrupted. If bears show intent, they will have to find the conviction anew. The first step to a bearish leg would be a clean break below 1.0580, but a run back up to 1.0700 would present just as credible a break (except that would be a bullish outcome).
Chart of EURUSD with 20-Day SMA (4 Hour)
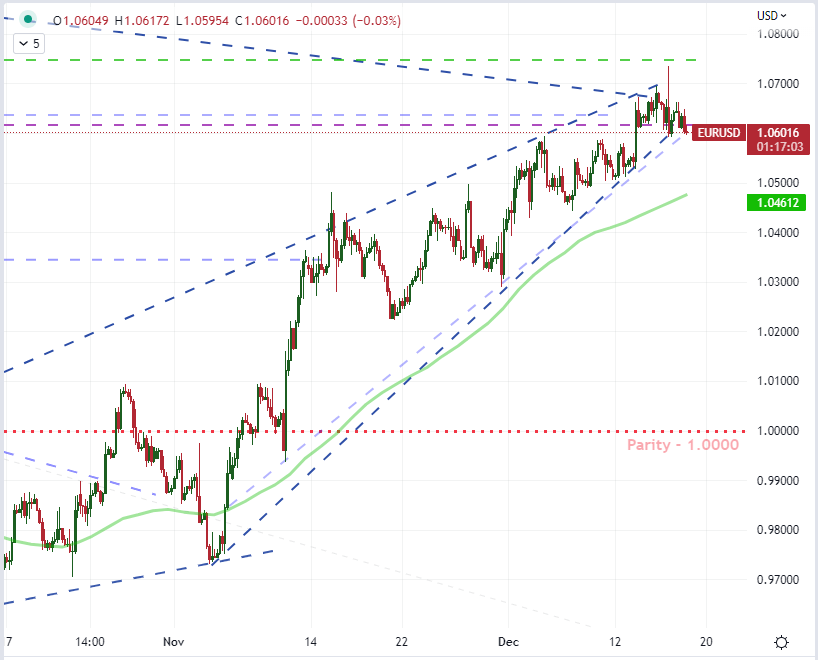
Chart Created on Tradingview Platform
Where EURUSD presents itself as a market that can break in either direction, USDJPY carries a little more weight with the bearish lean against the Greenback. Despite the Dollar’s efforts to firm against resistance against many other pairs Friday afternoon, this cross extended its retreat from the ‘pivot’ resistance (former support) around 137.50/138.00. That most proximate technical resistance carries some significant degree of weight with a frequent tests over the past month and now the 20-day moving average providing further backup. It is worth noting that as of Friday, the USDJPY has held below its 20-day SMA for 30 trading days. That’s the longest bearish stretch by this designation since June of 2019. Looking lower, the 200-day SMA is close at hand, but any real effort at traction would likely need to see the previous swing low just around 134 give. After that, the 38.2% Fib of the 2021-2022 range stands at 133.20.
Chart of USDJPY with 20 and 200-Day SMAs, 20-Day Disparity Index (Daily)
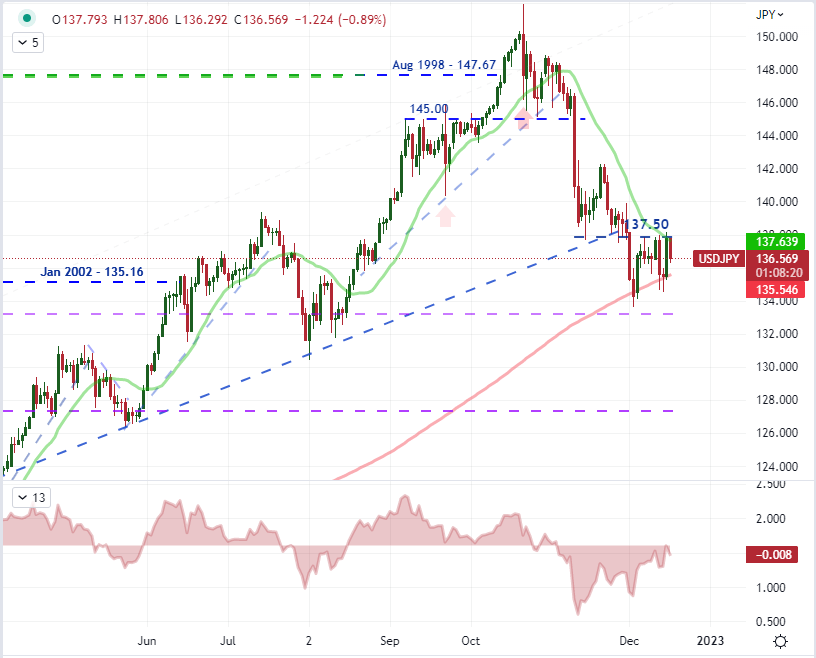
Chart Created on Tradingview Platform
There is not much ‘urgency’ in USDJPY’s turn lower. The congestion that it has formed these past few weeks looks more like a plateau to challenge in a larger overall turn which could take weeks to untangle – especially around holiday conditions. On the other hand, NZDUSD’s channel reversal is happening on a faster time frame. Using the 50-day SMA as a measure of tempo, the pair was rising (relative to the moving average) at the fastest clip in years up until it hit its peak around 0.6500 this past week. With the subsequent pullback, the floor of the clean rising trend channel it had formed falter. The break is in, but follow through seems to be waiting for deeper waters in the week ahead. Given that there was a bounce into Friday above the previous week’s range floor around 0.6305 which also happens to coincide with the 20-day SMA, any subsequent bearish efforts early next week could readily fulfill a H&S pattern on the lower time frame charts (the below chart is 8 hour candles).
Chart of NZDUSD with 20 and 200-Day SMAs (8 Hour)
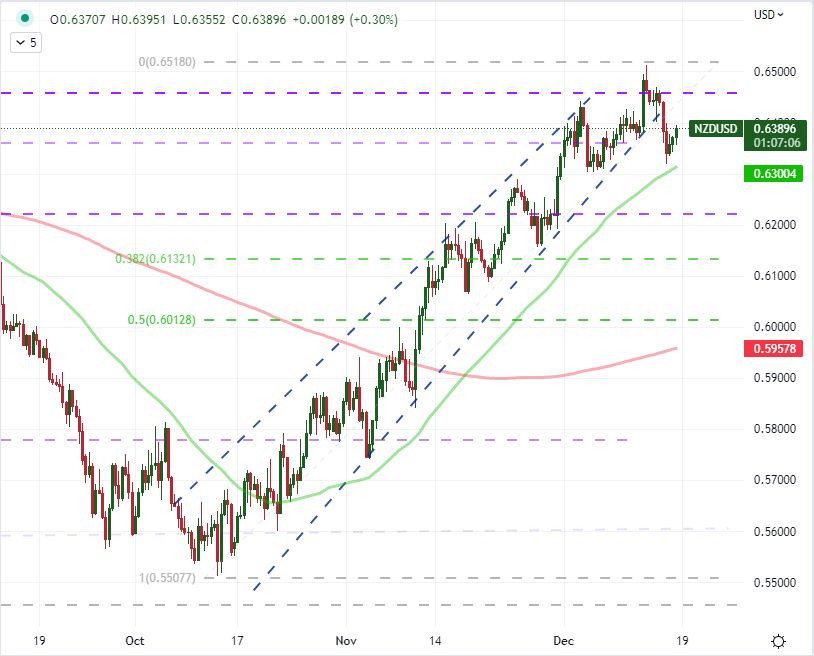
Chart Created on Tradingview Platform


