


CRUDE OIL, WTI - Technical Outlook:
- Crude oil has failed to break past key resistance areas in recent months.
- The path of least resistance is sideways to down.
- What are the key levels to watch?

CRUDE OIL TECHNICAL OUTLOOK - NEUTRAL
Crude oil’s failure in recent weeks/months to break past key resistance areas raises the odds of a prolonged period of sideway range.
On the monthly continuous contract charts, despite repeated attempts in early 2022, WTI crude oil was unable to decisively break past the 2011 high of 114.83. Moreover, the bearish crossover by the Moving Average Convergence Divergence indicator (MACD) confirms that medium-term upward pressure has faded somewhat (though still bullish as MACD remains in positive territory). Bearish crossovers in positive territory are a sign that bullishness is easing, but are not overtly bearish, and vice versa (see chart).
Crude Oil Monthly Chart
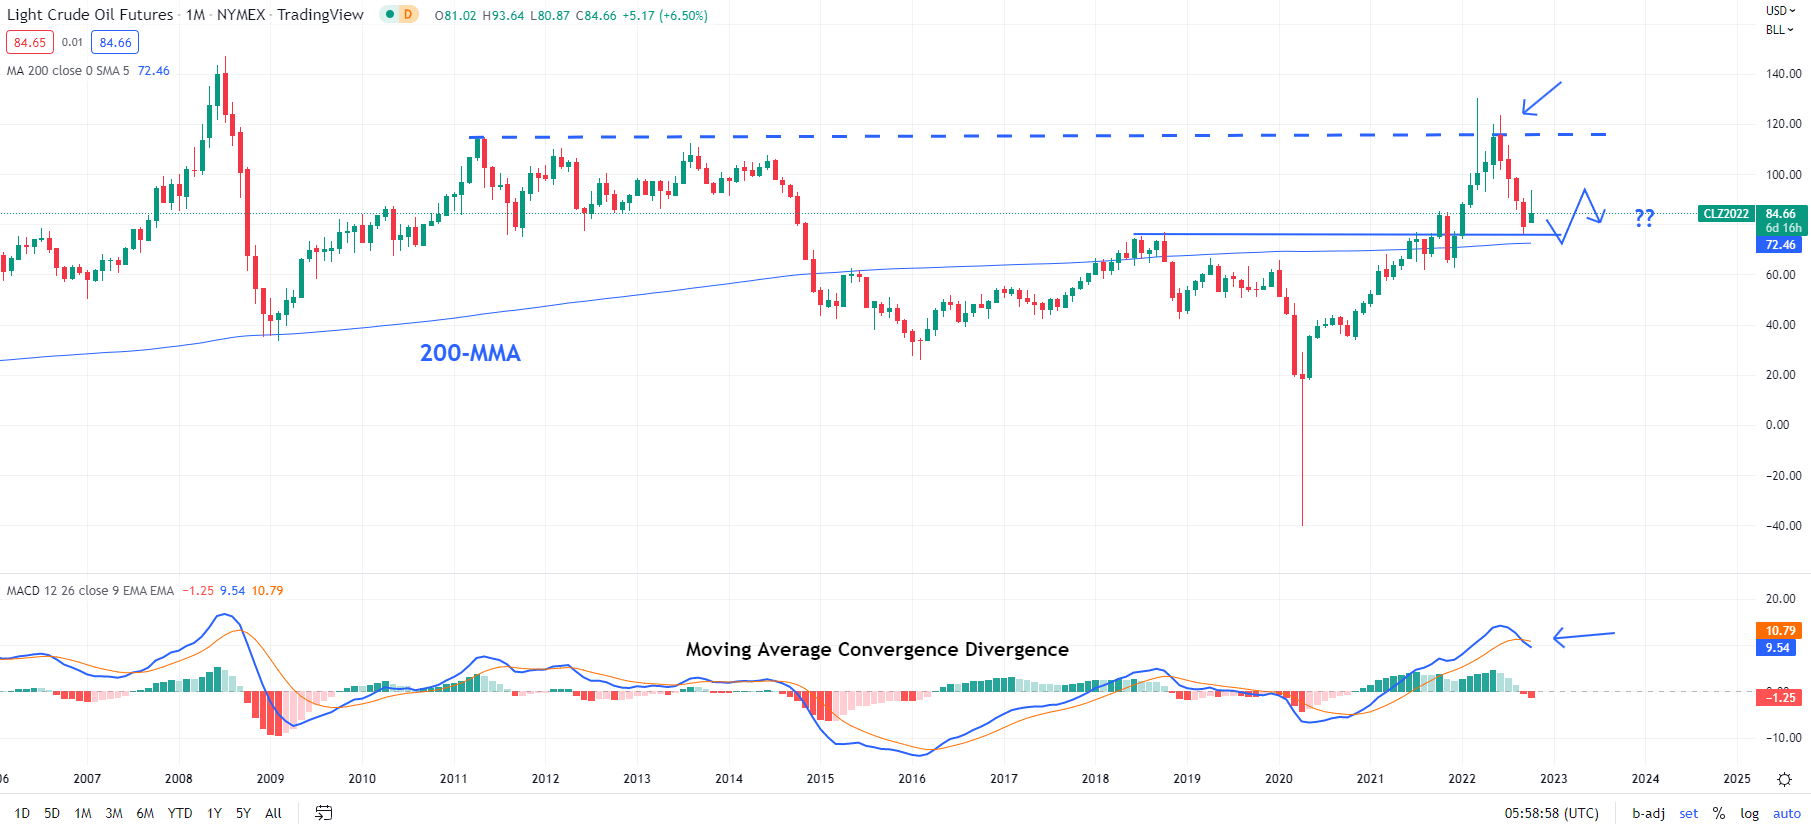
Chart Created Using TradingView
At the same time, on the daily charts, crude oil has retreated from near tough resistance on the 200-day moving average, roughly coinciding with a horizontal trendline from March at about 94.00. Furthermore, both the Plus Directional Movement Index (DMI) and Minus Directional Movement Index – which are measures of trend direction – are under the 25 mark, indicating a lack of bearing. Typically, in a rising market, the Plus DMI gauge tends to be above 25; in a bearish market, the Minus DMI tends to be above 25. When both the Plus and Minus DMIs are under 25, this indicates a sideway market.
Crude Oil Daily Chart
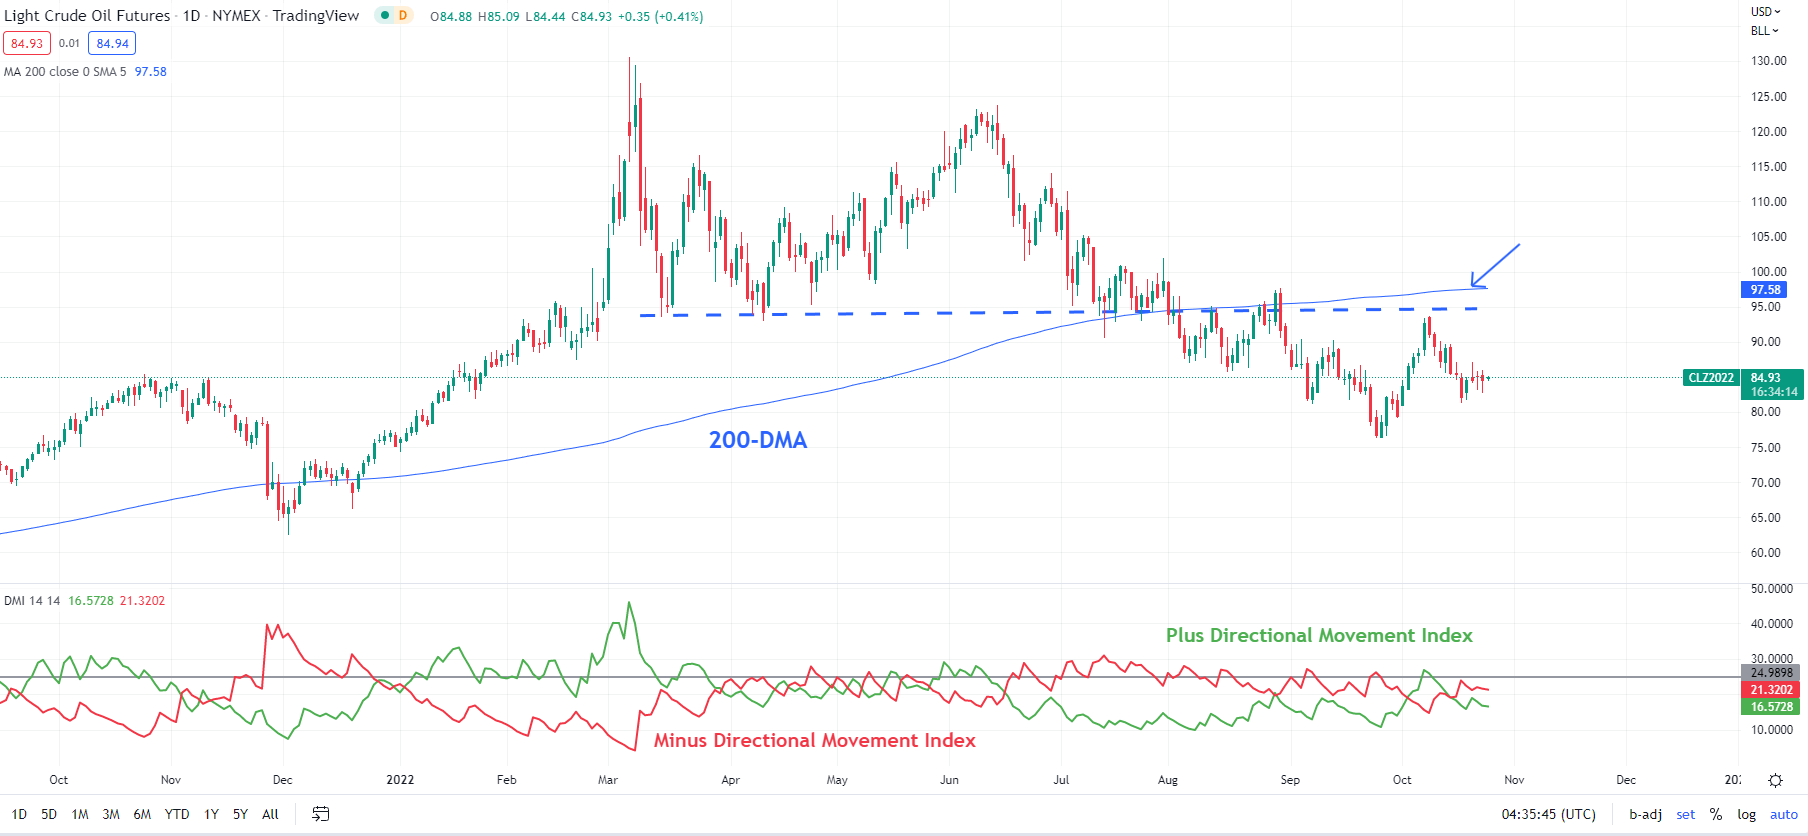
Chart Created Using TradingView
Unless oil can push above the 94-97 area (includes the 200-day moving average), the path of least resistance remains sideways to down. On the downside, there is immediate support at the September low of 76.25. Stronger support is on the 200-week moving average (now at about 64.00).

--- Written by Manish Jaradi, Strategist for DailyFX.com


