


Crude Oil, WTI, Retail Trader Positioning, Technical Analysis – IGCS Commodities Update
- Crude oil consolidation had continued in recent days
- But, retail traders are building downside exposure
- Is this a sign that WTI may resume higher next?

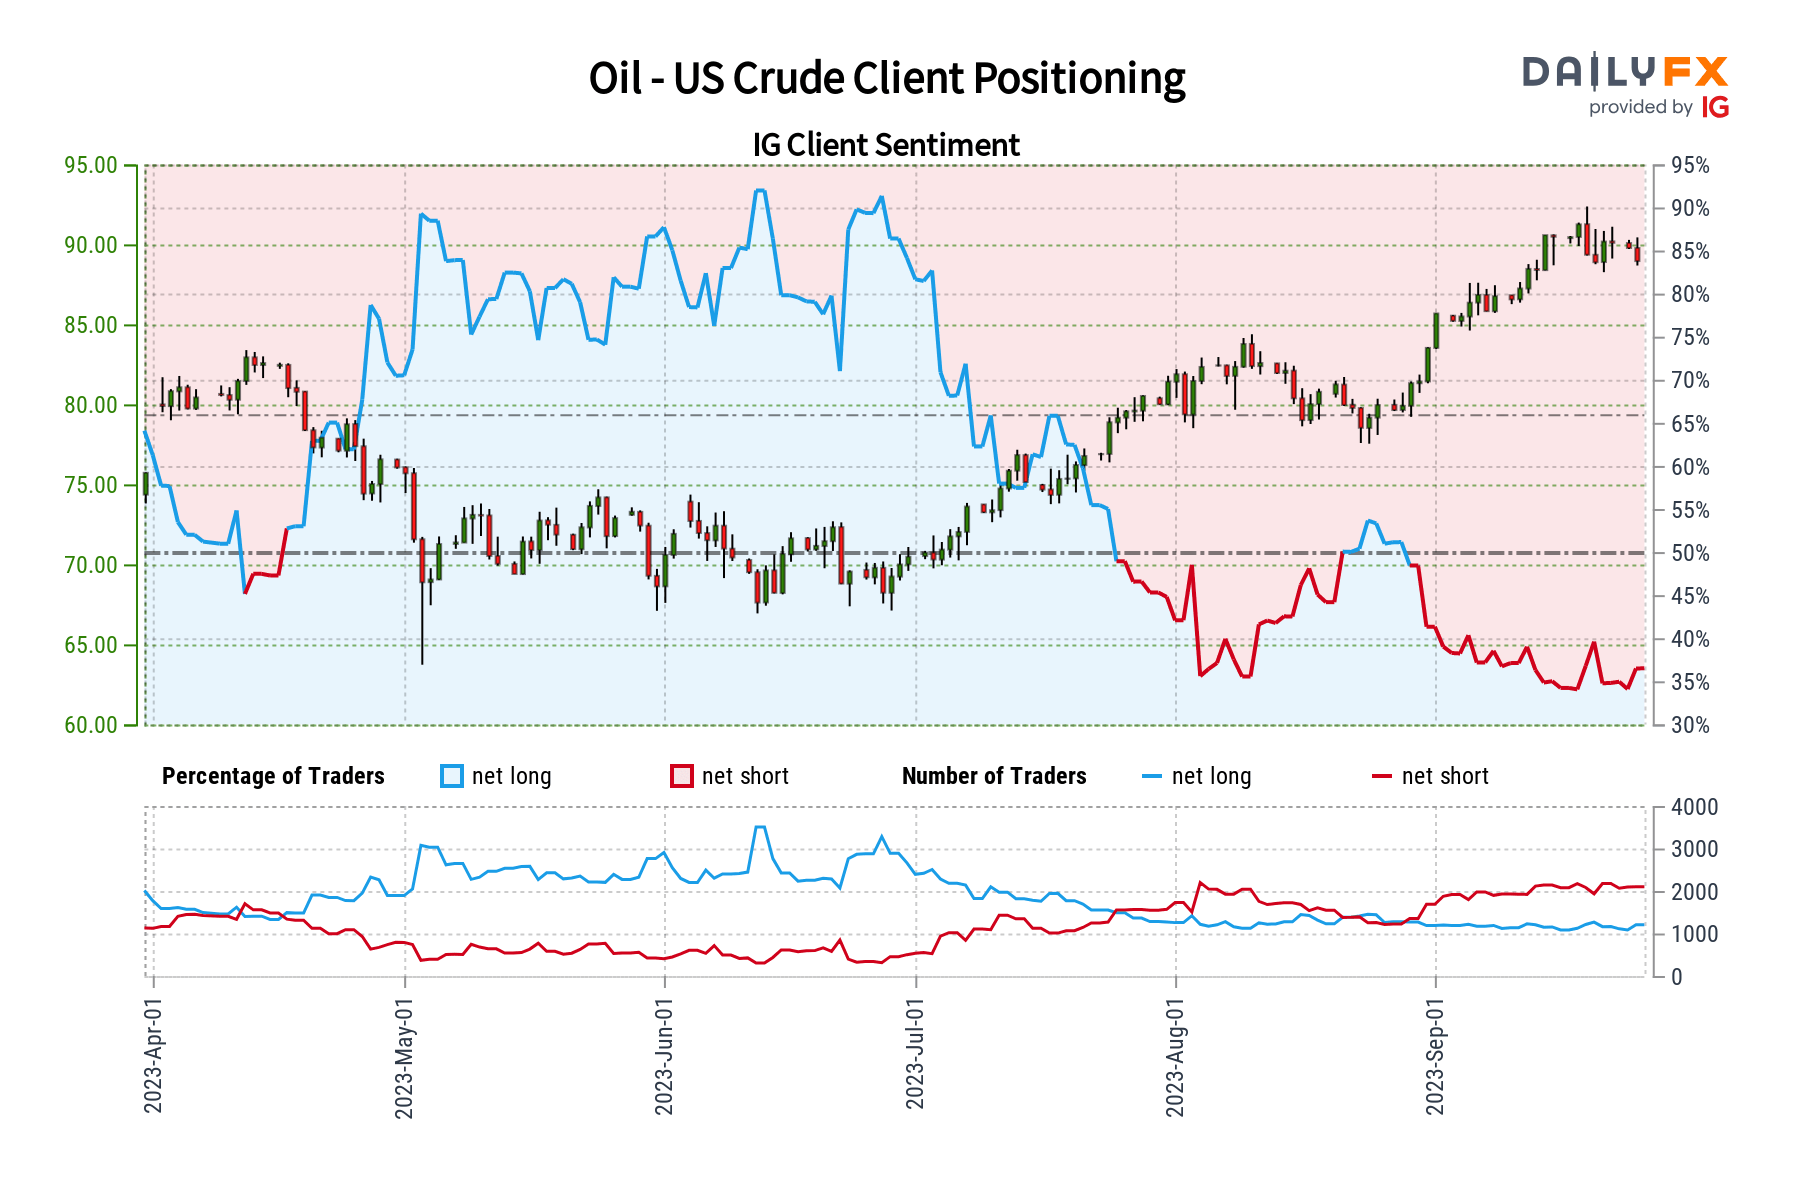
Crude oil prices have been consolidating as of late, taking a breather from the uptrend since June. While prices have been stagnant in recent days, retail trader exposure has not. This can be seen by taking a look at IG Client Sentiment (IGCS), which typically works as a contrarian indicator. The indicator shows that downside bets are slowly growing. What does this mean for WTI ahead?
Crude Oil Sentiment Outlook - Bullish
According to IGCS, only 36% of retail traders are net-long WTI. Since most of them are biased to the downside, this continues to hint that prices may rise down the road. This is as downside bets have increased by 12% and 6% compared to yesterday and last week, respectively. With that in mind, the combination of overall bets and recent changes offers a bullish contrarian trading bias.
| Change in | Longs | Shorts | OI |
| Daily | -7% | 11% | -3% |
| Weekly | 7% | 3% | 6% |
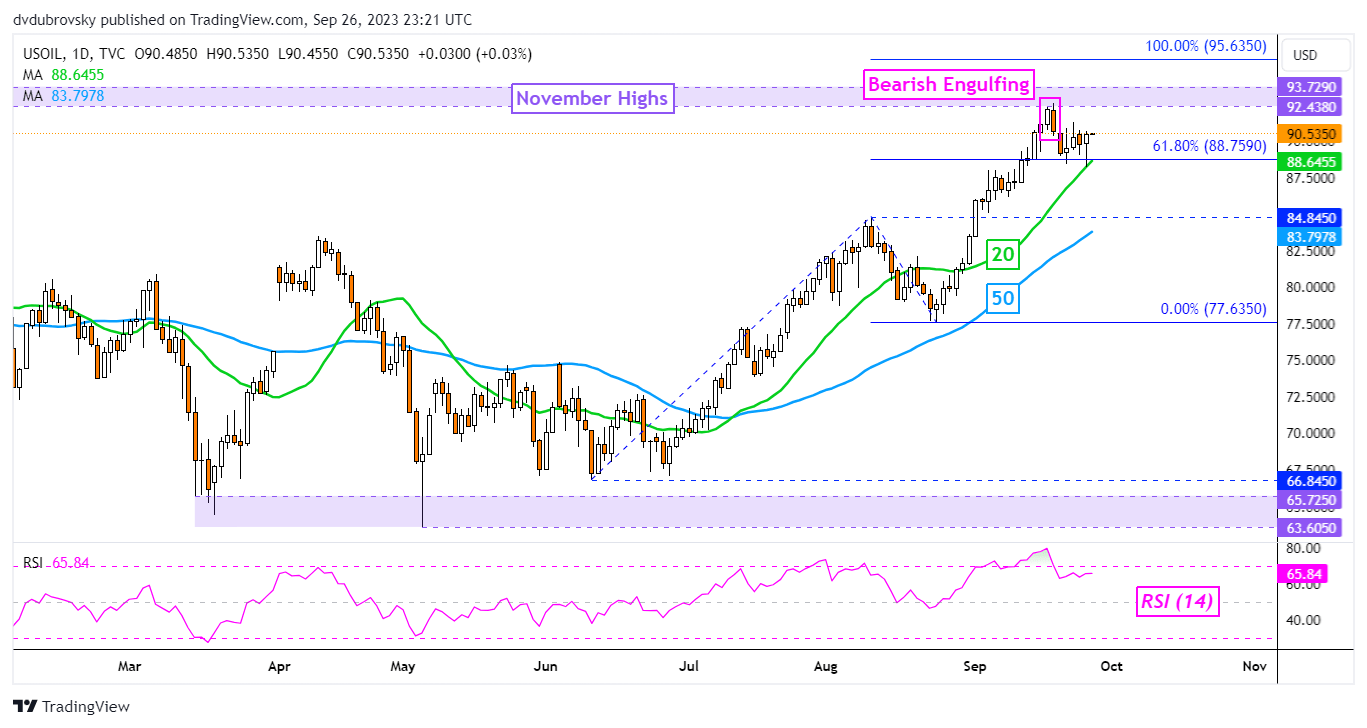
On the daily chart below, WTI was unable to break under the 20-day Moving Average, which held as support as prices left behind a lower wick. This also reinforced the 61.8% Fibonacci extension level at 88.75, maintaining the broader bullish technical bias. In the event of a breakout lower, keep a close eye on the 84.84 inflection point and the 50-day MA.
The latter may hold as support, maintaining the broader upside focus. Otherwise, pushing higher from here places the focus on November highs (92.43 – 93.72), undermining the Bearish Engulfing that emerged last week.

Crude Oil Daily Chart
-- Written by Daniel Dubrovsky, Senior Strategist for DailyFX.com


