


Australian Dollar, AUD/USD, USD Dollar, Momentum, Fibonacci -Talking Points
- The Australian Dollar’s run north appears to be stalling today
- Solid jobs numbers have reawakened a possible move by the RBA
- A pullback could test support. Will bullishness resume for AUD/USD?

The Australian Dollar has eased lower to start Monday after a stellar rally last week that posted a 4-month peak.
Rock solid jobs data revealed an unemployment rate of 3.6% and has opened the prospect of an RBA hike in a fortnight’s time. The interest rate market is pricing around a 50-50 chance of a 25 basis point lift at their monetary policy meeting on July 4th.
It is a holiday in the US today and it may contribute to less liquid trading conditions.
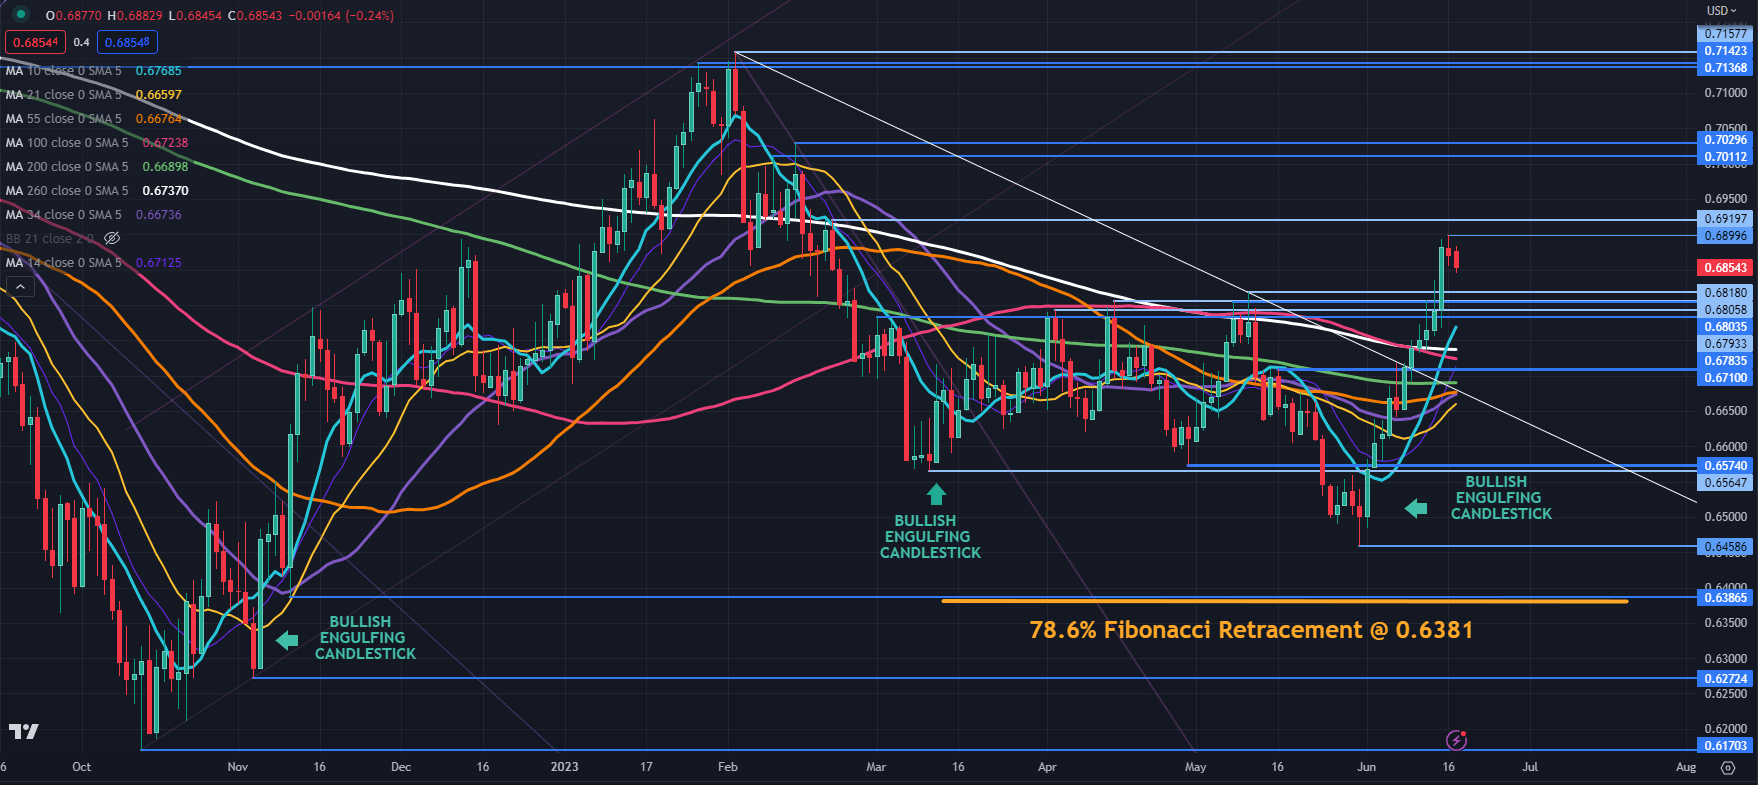
AUD/USD TECHNICAL ANALYSIS
AUD/USD shot to a high just shy of 69 cents last week, not far from a prior peak of 0.6920. Those levels might offer resistance should the rally resume.
Further up, resistance could be at the previous peaks of 0.7011 and 0.7030 ahead of a cluster zone in the 0.0.7137 – 0.7157 area.
The run-up in the Aussie started after a Bullish Engulfing Candlestick formation emerged and proved to be a salient signal on this occasion.
This technical indicator has previously been worthwhile watching and might be something to keep an eye on going forward. It should be noted though that past performance is not indicative of future results.
On the downside, prior resistance levels between 0.6780 – 0.6820 might now become a breakpoint support area.

Below there, the 10-, 14-, 21-, 34, 55-, 100-, 200- and 260-day Simple Moving Average (SMA) all lie between 0.6660 and 0.6769. Given the significant movement in AUD/USD, it is unusual for all of these SMAs to be bunched reasonably close to one another.
If the price remains above these SMAs, it could be suggesting that bullish momentum is evolving. If it went below these SMAs, it may indicate that the bullishness may no longer persist, and bearish momentum might unfold.
Support could be at the breakpoints of 0.6710, 0.6574 and 0.6565 or the late May low of 0.6458.
Further down, support may lie at the prior low of 0.6387 and the nearby Fibonacci level of 0.6381. The latter is the 78.6% Fibonacci Retracement of the move from the low of 0.6170 to the peak of 0.7158.
AUD/USD DAILY CHART
--- Written by Daniel McCarthy, Strategist for DailyFX.com
Please contact Daniel via @DanMcCarthyFX on Twitter


