


ASX, ASX 200 INDEX, KOSPI, KOSPI COMPOSITE INDEX - TECHNICAL OUTLOOK:
- The ASX 200 index’s rally is showing signs of fatigue.
- KOSPI could be gearing up for a catch up rally.
- What are the key levels to watch?

ASX 200 TECHNICAL OUTLOOK – BULLISH
Australia ASX 200 index’s rally is showing signs of fatigue as it tests tough converged resistance on a rising trendline from a year ago and the April 2022 high of 7624, shade below the record high of 7633 hit in 2021. Flagging momentum on the daily chart -- the 14-day Relative Strength Index (RSI) has been turning lower just as the index rose to a fresh higher earlier this week -- suggests the index could find it difficult to crack the converged ceiling.
ASX 200 INDEX Daily Chart
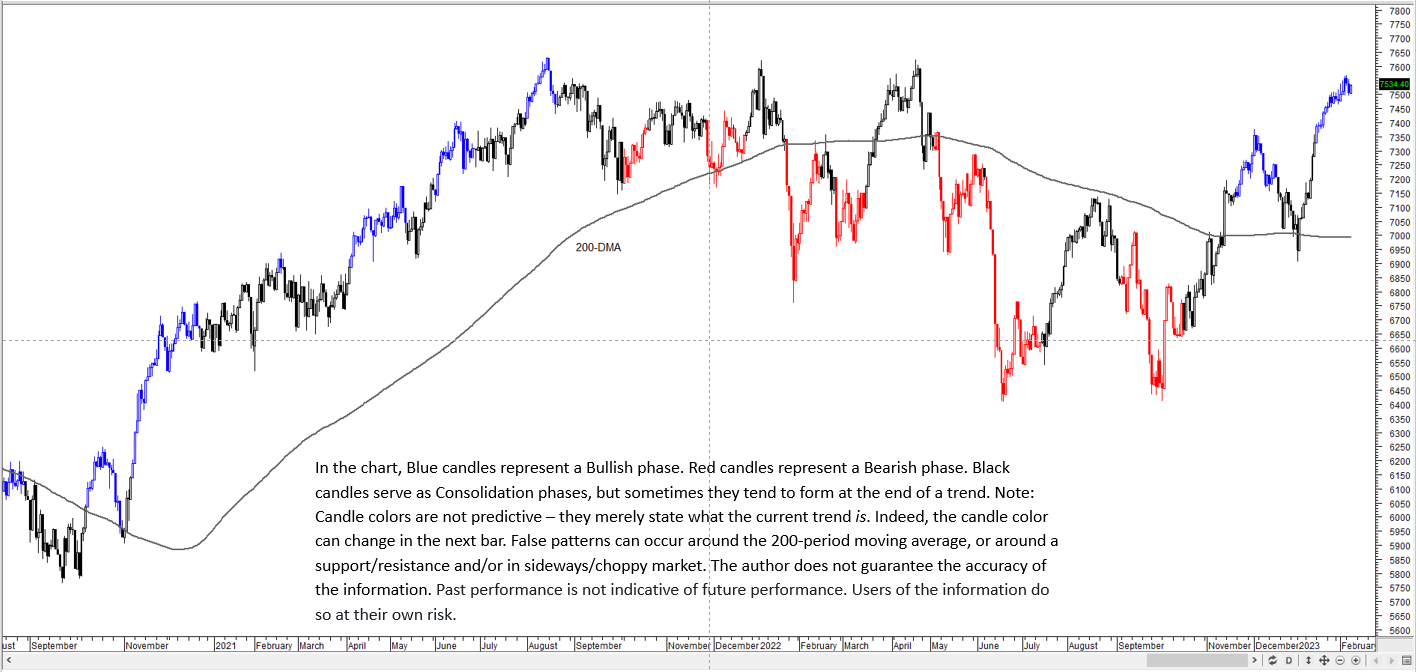
Chart Created by Manish Jaradi using Metastock
From a directional perspective, on the daily charts, the trend is up (see the daily chart). However, some consolidation/a minor retreat can’t be ruled out given overbought conditions. Moreover, in the last couple of weeks or so, the index has struggled to extend gains, potentially a sign of buyer fatigue.
ASX 200 INDEX Daily Chart
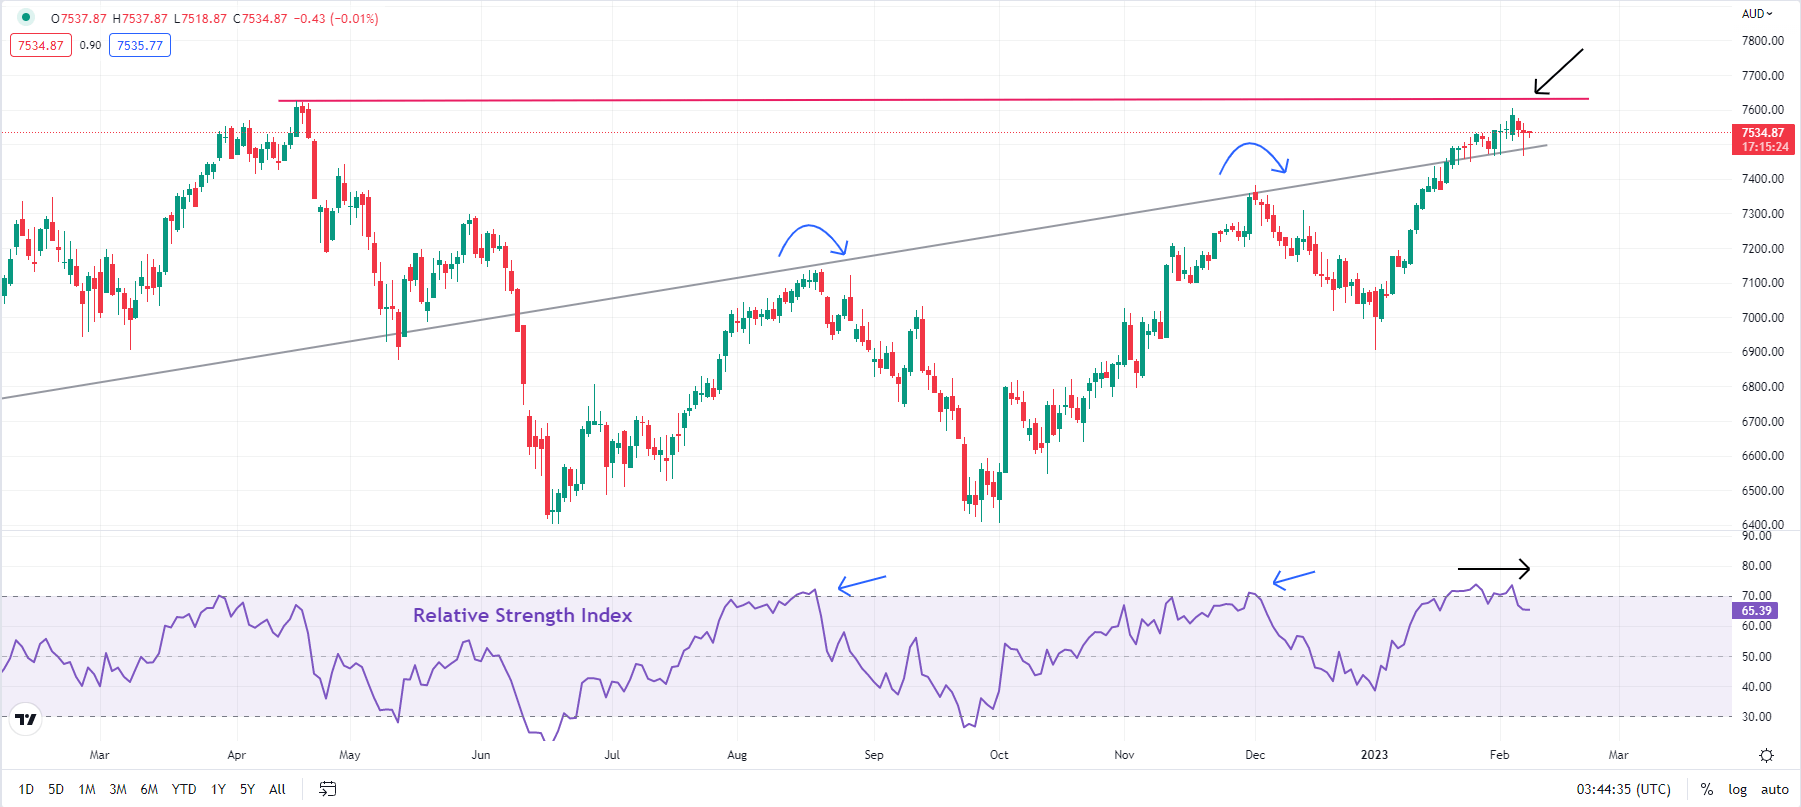
Chart Created by Manish Jaradi Using TradingView
Immediate support is at the December high of 7375. Any break below would indicate that the short-term upward pressure had faded, pointing to a range developing. The broader uptrend is unlikely to be threatened while the index holds above the 200-day moving average (now at about 7000). As highlighted in the previous update, the break toward the end of 2022 above the August high of 7138 triggered a double bottom (the June 2022 and the October 2022 lows), pointing to a potential rise toward 7865.
KOSPI COMPOSITE INDEX TECHNICAL OUTLOOK - NEUTRAL
The Kospi Composite Index has lagged some of its peers in recent weeks but appears to be getting ripe for a rally.
KOSPI Daily Chart
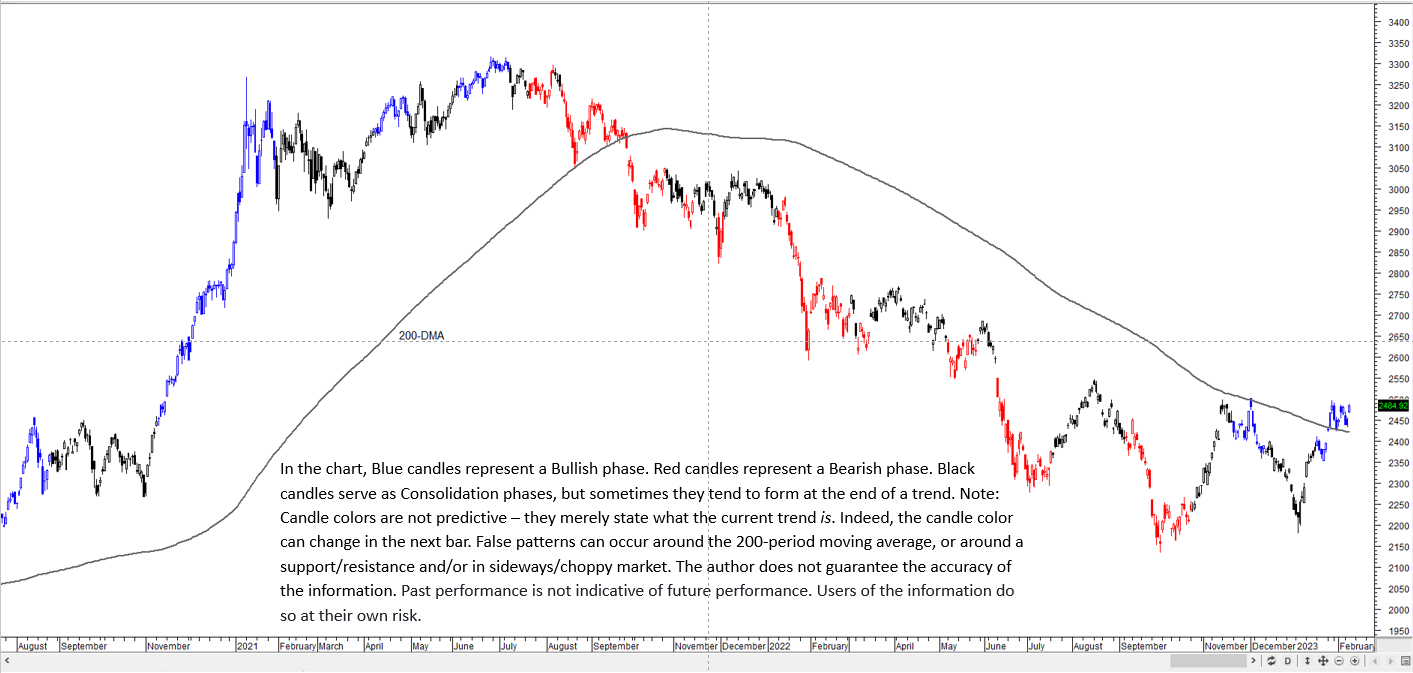
Chart Created by Manish Jaradi using Metastock
The South Korean benchmark index is attempting to rise above crucial resistance that could shape the trajectory for the coming weeks. A decisive break (2 daily closes) above the marginally downward-sloping trendline from August (at about 2480) would trigger a reverse head & shoulders pattern (the left shoulder is the mid-2022 low, the head is the September low, and the right shoulder is the early-January low), paving the way toward 2870.
KOSPI Daily Chart
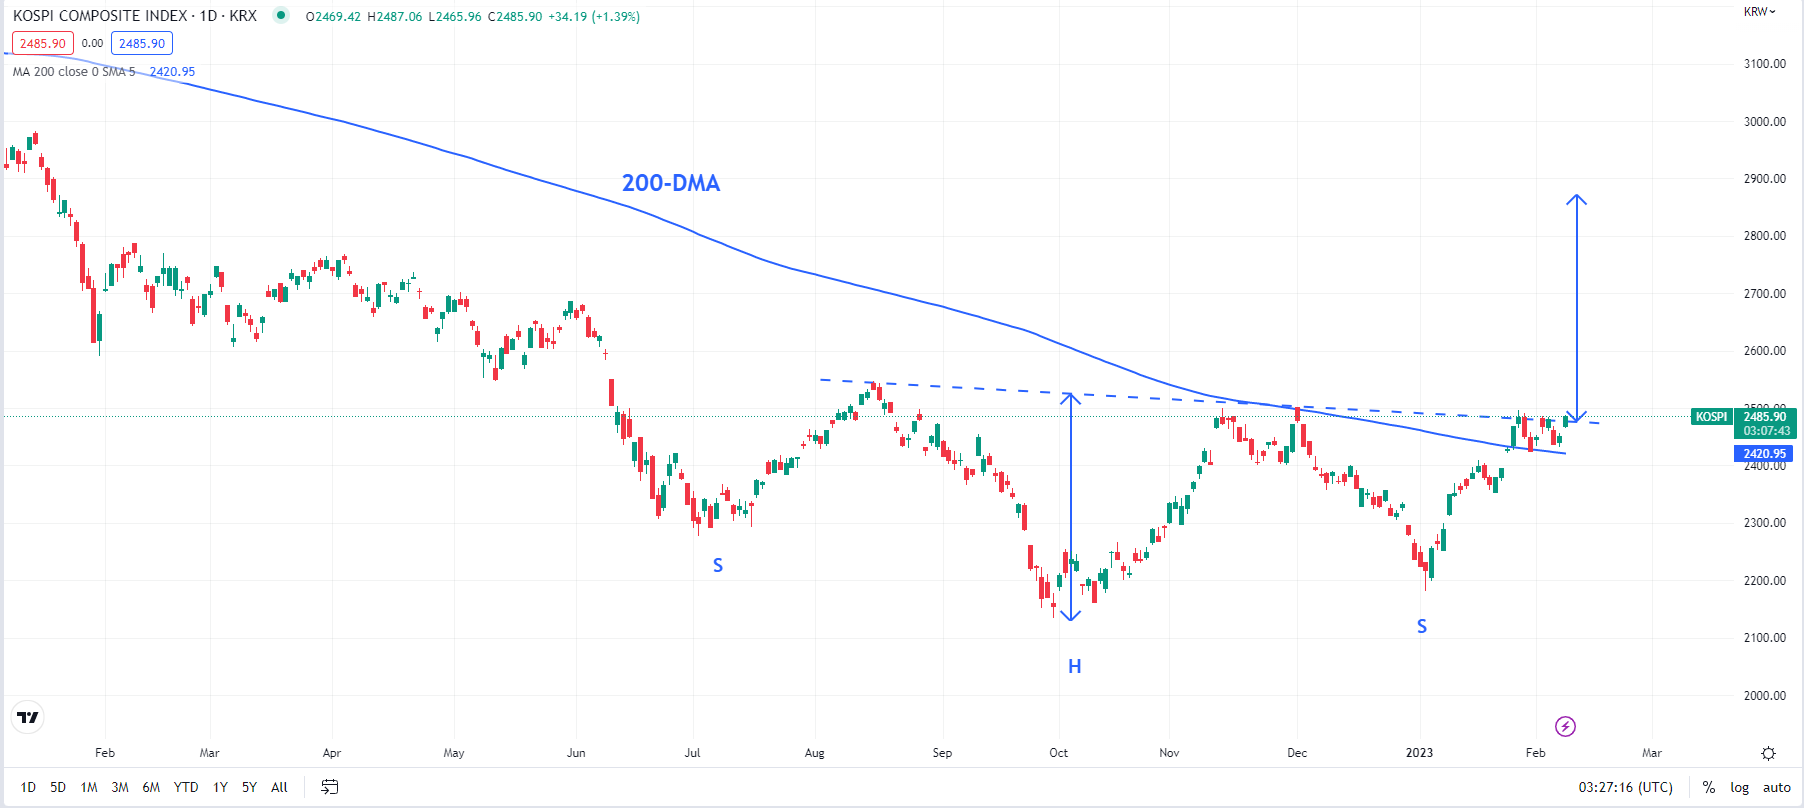
Chart Created by Manish Jaradi Using TradingView
Such a break would also coincide with a rise above the 200-day moving average for the first time since late 2021 – a sign that the multi-month downward pressure was fading. For the bullish view to unfold, the index, at minimum, needs to hold above immediate support at the mid-January low of 2355. Strong support is at the early-January low of 2181.
--- Written by Manish Jaradi, Strategist for DailyFX.com


