


FX Price Action Setups in USD/JPY, GBP/JPY and USD/CAD
It’s been an intense start to 2019. While risk aversion ran in a fairly visible manner through Q4 of last year, the past 24 hours have seen that fear seep into the currency market. Current concerns appear to have started around an after-the-bell warning from Apple. I had mentioned this as a risk coming into the month of November, as some curious things were taking place around what was, at the time, the world’s most valuable public company. I had warned of this in the webinar just head of their quarterly earnings announcement, and since then Apple stock has been on a difficult ride. Yesterday’s warning continued that theme, and this appeared to have sparked some significant strength in the Japanese Yen. USD/JPY tested below 105.00, EUR/JPY tested below 120.00 and GBP/JPY dipped below 132.00, more than 1300 pips below where the pair was trading at just last month.
In this webinar, I looked at price action setups across a wide swath of currency pairs.
Forex Talking Points:
- If you’re looking to improve your trading approach, our Traits of Successful Traders research could help. This is based on research derived from actual results from real traders, and this is available to any trader completely free-of-charge.
- If you’re looking for a primer on the FX market, we can help. To get a ground-up explanation behind the Forex market, please click here to access our New to FX Trading Guide.
If you’d like to sign up for our webinars, we host an event on Tuesday and Thursday, each of which can be accessed from the below links:
Tuesday: Tuesday, 1PM ET
Thursday: Thursday 1PM ET
USD/JPY Snaps Back After Fear-Fueled Yen Rally
I had started looking at the short side of the pair less than a month ago, and the pair has since traded-lower by as much as 800 pips. Last night’s Yen-rally was soon met by a bout of Yen weakness and prices in USD/JPY have retraced a chunk of that prior sell-off. I had discussed this setup earlier this morning, but USD/JPY bulls appear to be trying to push through the 108.00 level, and a bit-higher on the chart is a zone of interest that runs from 108.47-108.70. Sellers showing up upon a retest here keeps the door open for short-side setups; and if that doesn’t hold the highs, another zone of interest sits at 109.66-110.00.
USD/JPY Hourly Price Chart
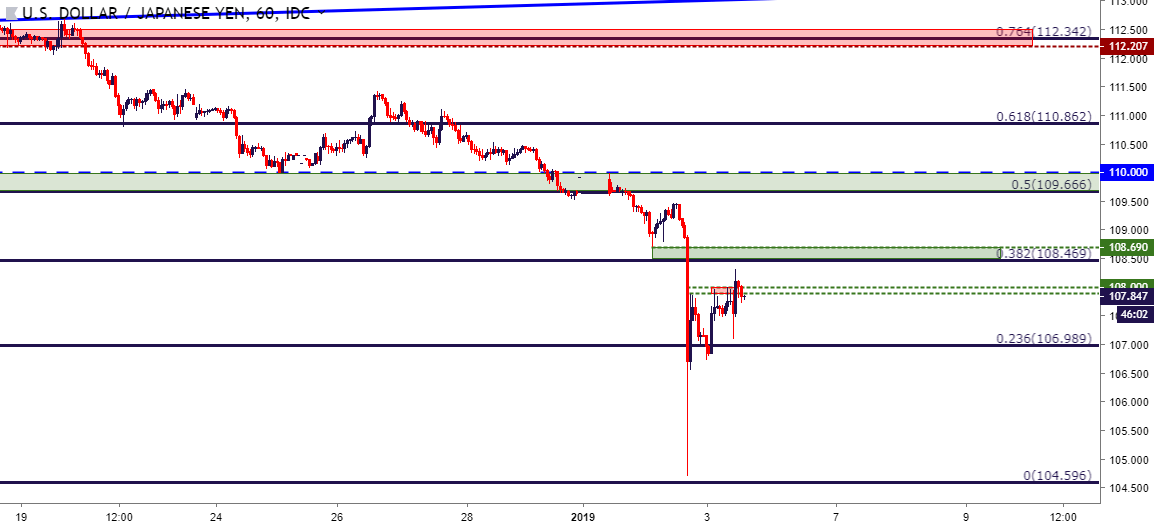
Chart prepared by James Stanley
EUR/JPY: Is 125.00 Possible?
The short side of EUR/JPY was my Top Trade for this year, and the setup has already moved in for a test of the first target at 120.00; but similar to USD/JPY, prices have continued to claw back prior losses and that may have continuation potential. In EUR/JPY, the big question is what happens upon a re-test of 125.00. This price had provided a double-bottom last year; and prices plummeted through yesterday. A continuation in the pullback to find resistance at this prior area of support re-opens the door for short-side strategies.
EUR/JPY Daily Price Chart
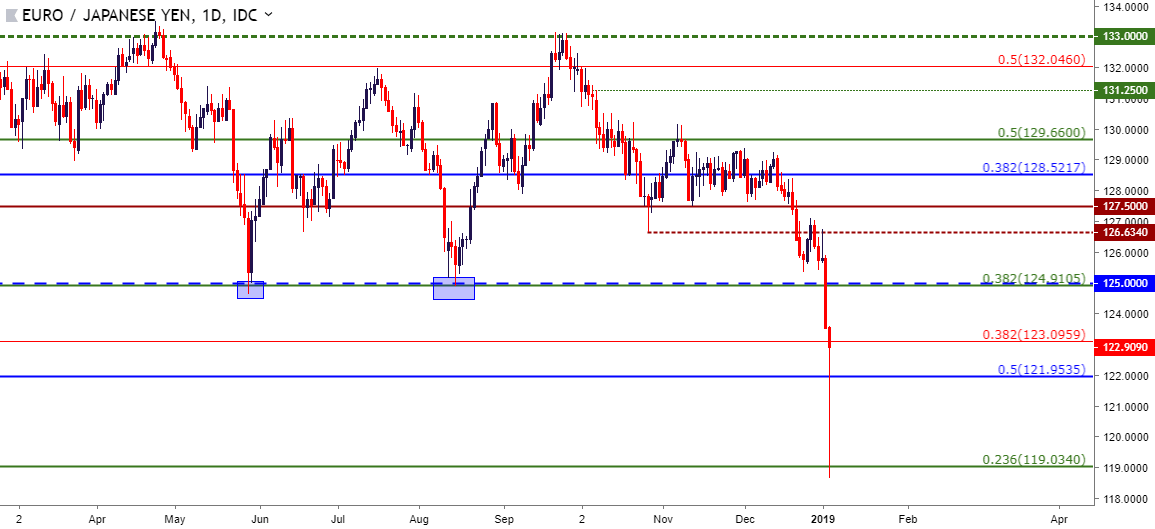
Chart prepared by James Stanley
GBP/JPY Reversal Potential
A combination of GBP weakness and JPY strength helped to produce a really ugly start to 2019 price action for GBP/JPY. There may be scope for continued recovery here, however, as the pair has put in a fairly consistent pattern of higher-highs and lows since last night’s spill. A check of higher-low support at the Fibonacci level around 135.87, which had helped to provide a bit of short-term resistance earlier this morning, can open the door for bullish potential.
GBP/JPY Hourly Price Chart
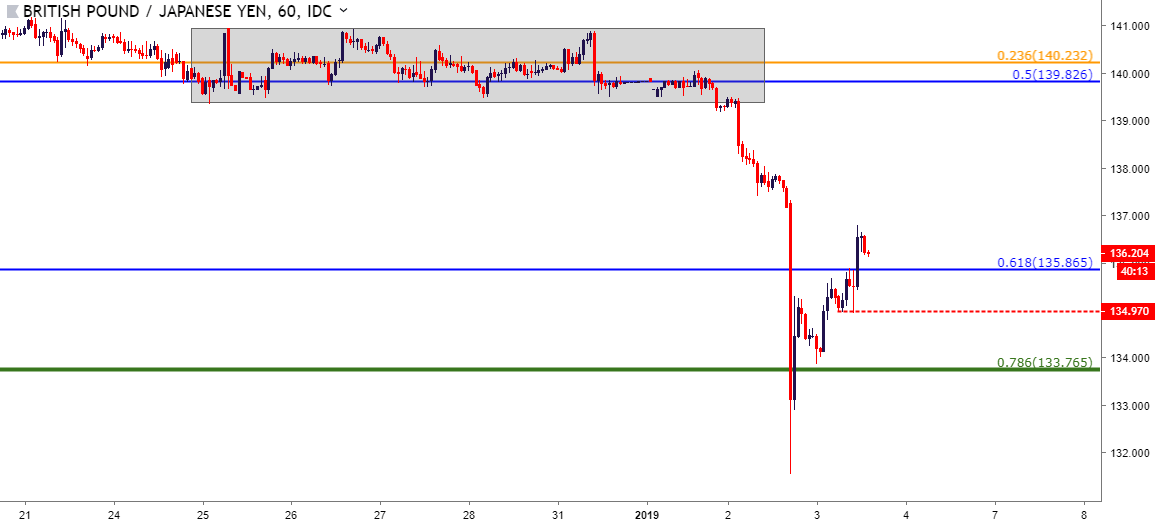
Chart prepared by James Stanley
Dow Holds Resistance at Confluent Level
I had written about this yesterday, and this level remains as resistance in the Dow as there’s a confluent spot on the charts around the 23,300 area. This is the 38.2% retracement of the December sell-off which meshes up with the 38.2% retracement of the November 2016 – October 2018 major move. Until this level is taken out with buying pressure, bullish strategies can remain of a challenge here. But – for bearish strategies, European stocks may still be more attractive for such scenarios.
Dow Jones Daily Price Chart
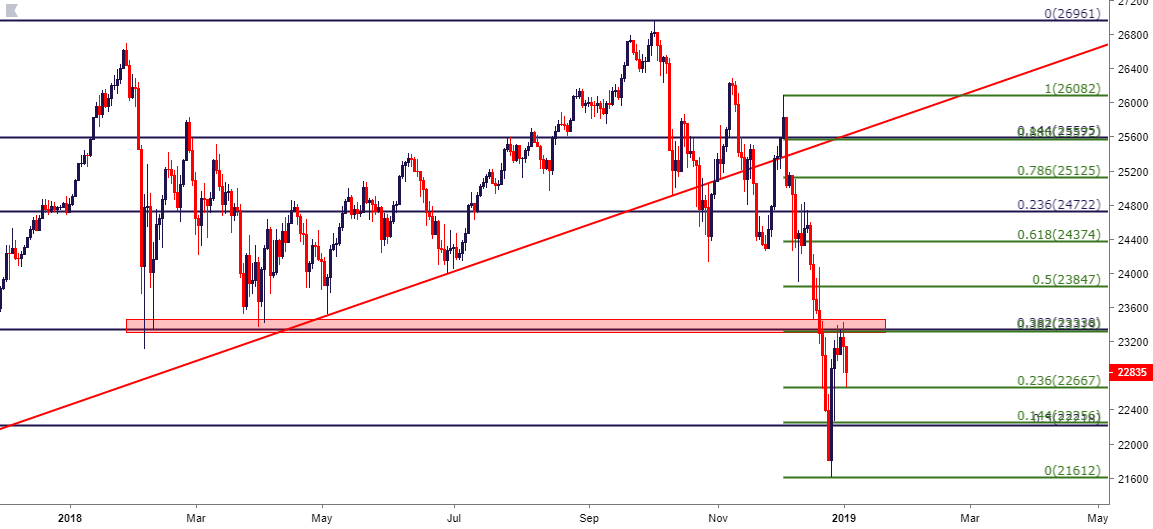
Chart prepared by James Stanley
US Dollar Relatively Calm, All Factors Considered
This may not last for much longer given the NFP report that sits on tomorrow’s calendar, but all factors considered, the US Dollar has had a rather calm start to 2019. Prices trickled lower to start the year, finding a bit of support on the November low at which point bulls came back; but that driver has largely dissipated over the past 24 hours as prices have slid back down. I had looked at the US Dollar in the DailyFX Q1 Technical Forecast, and as I shared there, I’m looking for USD to continue its slide-lower.
US Dollar Four-Hour Price Chart
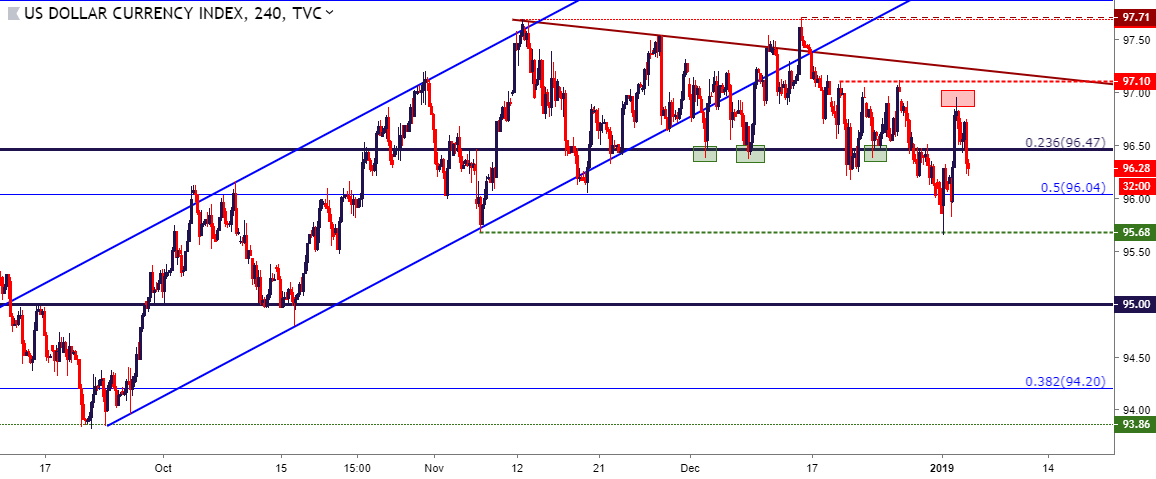
Chart prepared by James Stanley
USD/CAD Pulls Back – Trend-Line Test
USD/CAD had a really strong month of December, even as the US Dollar was topping out and moving lower. This indicates just how weak the Canadian Dollar had become, and already in the opening days of 2019 that strong topside trend in USD/CAD has pulled back to a key level. As shown on shorter-term charts in the webinar, prices appear to be trying to cauterize support around a trend-line that’s been in play since early-October. I went over a couple of different ways this could be handled, and there’s a deeper support area of interest around 1.3423 that can keep the door open for bullish strategies in the pair.
USD/CAD Eight-Hour Price Chart
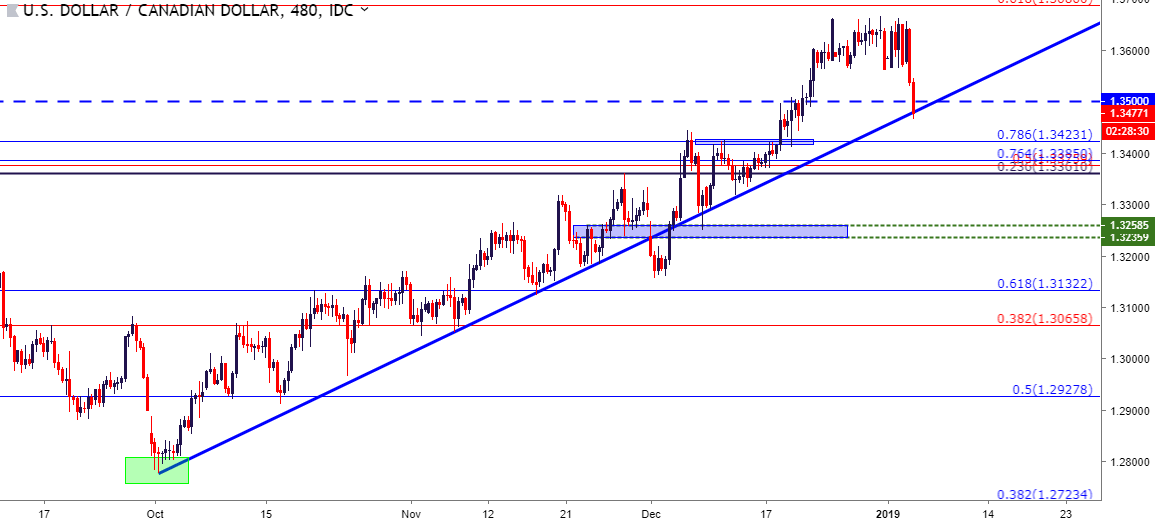
Chart prepared by James Stanley
Aussie ‘flash crash’ as AUD/USD Runs to .6750
If there is one market that did exhibit a ‘flash crash’ yesterday, it would’ve been the Aussie, as the pair plummeted against both the Yen and the US Dollar. This continues the AUD/USD reversal that showed-up in the first week of December. Prices had started to tip-toe below the .7000 big figure yesterday, but it was around that 5:00 PM slam that matters really hit fever pitch. The big question now is for how long might this recovery continue? Prices are back above .7000, and sellers appear to be reacting off of a prior short-term support swing. A bit deeper, around .7075 is another area of resistance potential that can keep the door open for bearish strategies in the pair.
AUD/USD Eight-Hour Price Chart
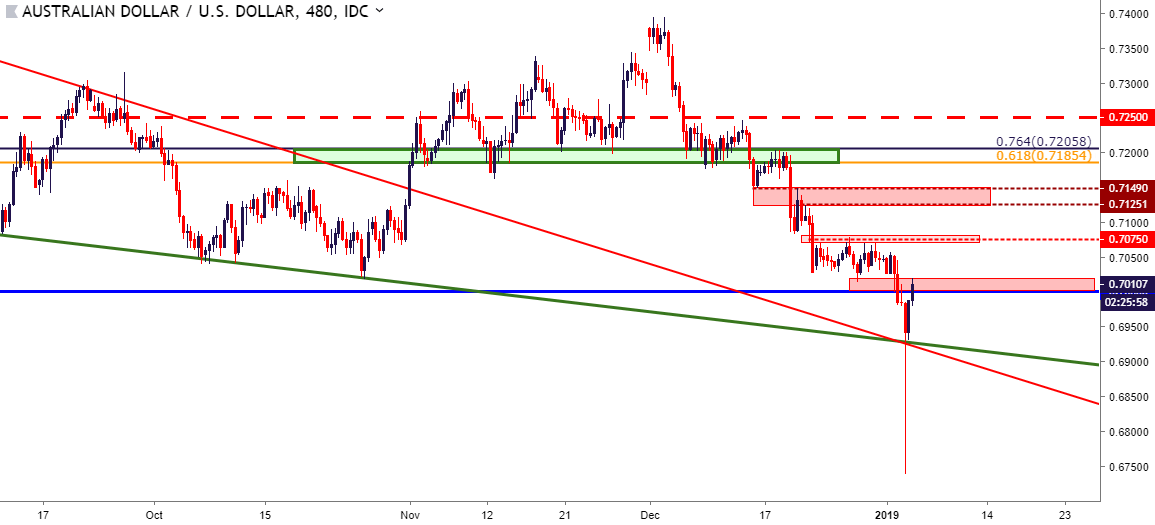
Chart prepared by James Stanley
To read more:
Are you looking for longer-term analysis on the U.S. Dollar? Our DailyFX Forecasts for Q4 have a section for each major currency, and we also offer a plethora of resources on USD-pairs such as EUR/USD, GBP/USD, USD/JPY, AUD/USD. Traders can also stay up with near-term positioning via our IG Client Sentiment Indicator.
Forex Trading Resources
DailyFX offers an abundance of tools, indicators and resources to help traders. For those looking for trading ideas, our IG Client Sentiment shows the positioning of retail traders with actual live trades and positions. Our trading guides bring our DailyFX Quarterly Forecasts and our Top Trading Opportunities; and our real-time news feed has intra-day interactions from the DailyFX team. And if you’re looking for real-time analysis, our DailyFX Webinars offer numerous sessions each week in which you can see how and why we’re looking at what we’re looking at.
If you’re looking for educational information, our New to FX guide is there to help new(er) traders while our Traits of Successful Traders research is built to help sharpen the skill set by focusing on risk and trade management.
--- Written by James Stanley, Strategist for DailyFX.com
Contact and follow James on Twitter: @JStanleyFX


