


To receive Ilya's analysis directly via email, please SIGN UP HERE
Talking Points:
- USD/JPY Technical Strategy: Flat
- Support: 119.66, 118.93, 118.20
- Resistance: 120.68, 121.41, 122.13
The US Dollar may be readying to turn lower against the Japanese Yen after prices produced a bearish Dark Cloud Cover candlestick pattern. A daily close below the 38.2% Fibonacci retracementat 119.66 exposes the 50% level at 118.93. Alternatively, move above the 38.2% Fib expansion at 120.68 opens the door for a challenge of the 50% threshold at 121.41.
A short trade looks tempting from a purely technical perspective but we will tactically opt to stay flat. USDJPY seem to have resumed a long-standing rising trend having completed a Flag chart formation, painting any near-term weakness as corrective. With that in mind, we will wait for a buying opportunity following a downswing to establish exposure.
Add these technical levels directly to your charts with our Support/Resistance Wizard app!
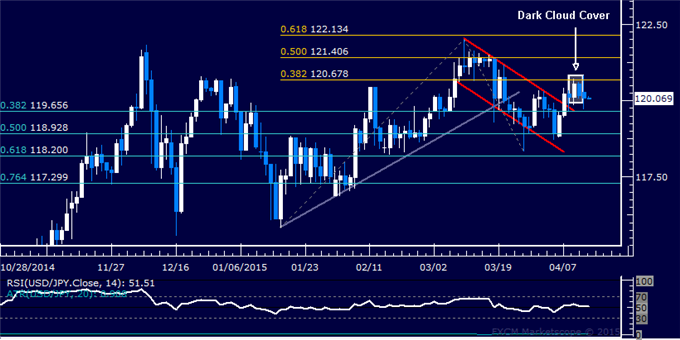
Daily Chart - Created Using FXCM Marketscope
--- Written by Ilya Spivak, Currency Strategist for DailyFX.com


