


Talking Points:
- US Dollar Trying to Renew Uptrend After Correcting Lower
- S&P 500 Fails to Hold Above Near-Term Range Top Again
- Gold Digesting Gains, Crude Oil Eyes Resistance Above $59
Can’t access the Dow Jones FXCM US Dollar Index? Try the USD basket on Mirror Trader. **
US DOLLAR TECHNICAL ANALYSIS – Prices areattempting to launch a recovery after moving downward as expected. Near-term support is in the 11858-86 area (March 18 low, 23.6% Fibonacci retracement), with a break below that on a daily closing basis exposing the 38.2% level at 11679. Alternatively, a turn above the 14.6% Fib expansion at 12066 clears the way for a test of the 12149-77 zone (March 13 high, 23.6% threshold).
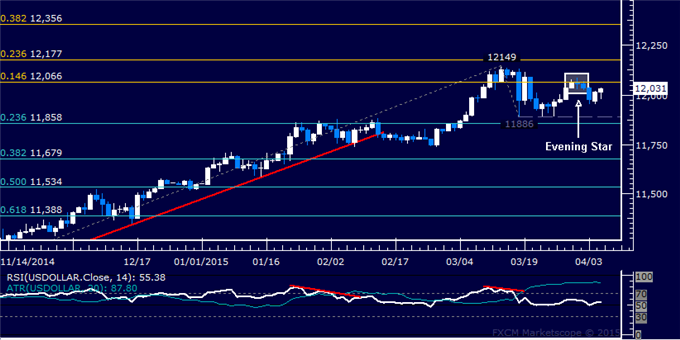
Daily Chart - Created Using FXCM Marketscope
** The Dow Jones FXCM US Dollar Index and the Mirror Trader USD basket are not the same product.
S&P 500 TECHNICAL ANALYSIS – Prices are consolidating after moving lower as expected following the appearance of a bearish Evening Star candlestick pattern. A daily close below the March 12low at 2040.10 exposes the 38.2% Fibonacci retracement at 2004.60. Alternatively, a reversal above the 14.6% Fib expansion at 2084.00 targets the 2111.00-19.40 area (23.6% threshold, February 25 high).
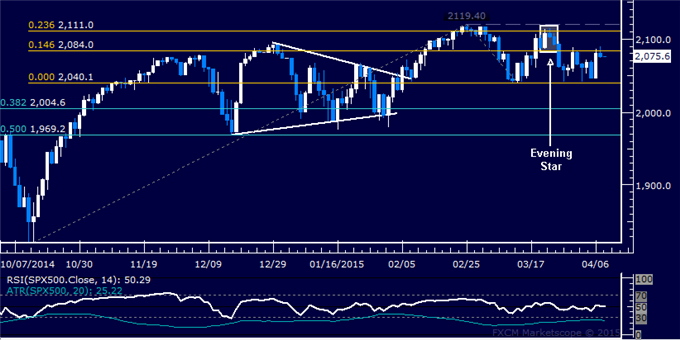
Daily Chart - Created Using FXCM Marketscope
GOLD TECHNICAL ANALYSIS – Prices paused to digest gains after rising to test the highest level since mid-February. A daily close above the 50% Fibonacci expansion at 1216.99 exposes the 61.8% level at 1226.11. Alternatively, a reversal below the 38.2% Fib at 1207.88 targets the 23.6% expansion at 1196.61.
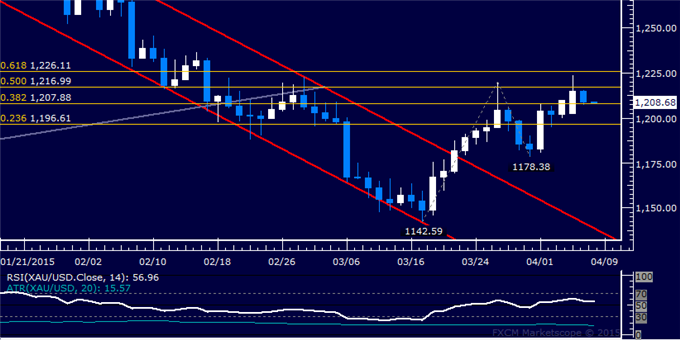
Daily Chart - Created Using FXCM Marketscope
CRUDE OIL TECHNICAL ANALYSIS – Prices are aiming to test resistance at 59.35, the 38.2% Fibonacci expansion, after pushing above the 23.6% level at 56.75. A daily close above resistance exposes the 50% Fib at 61.45. Alternatively, a reversal back below 56.75 targets the 14.6% expansion at 55.15.
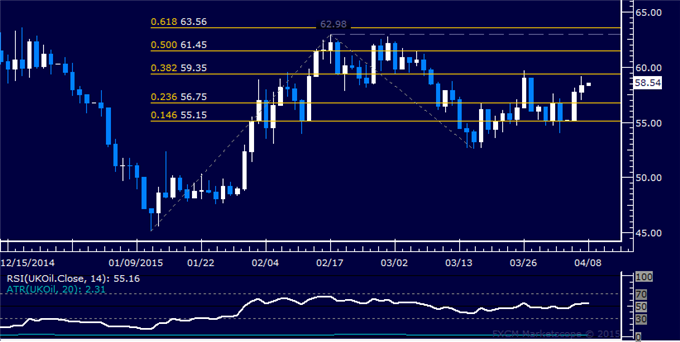
Daily Chart - Created Using FXCM Marketscope
--- Written by Ilya Spivak, Currency Strategist for DailyFX.com
To receive Ilya's analysis directly via email, please SIGN UP HERE
Contact and follow Ilya on Twitter: @IlyaSpivak


