Summary:
- EUR/USD may be nearing an attractive area to look for longer-term short positions.
- Chinese PMI disappointed again, printing at 47 v/s an expectation of 47.5.
- Weakness continues to show in global stocks in the wake of last week’s FOMC announcement.
1. Want to time the EUR/USD short position? Watch SSI: One of the more interesting developments since last week’s FOMC announcement has been renewed weakness in the Euro as the Fed’s hawkish stance contrasts nicely with the accommodative, looser monetary policy expectations out of Europe. At the most recent ECB meeting, Mr. Mario Draghi had mentioned that the bank could expand the bond-buying program if necessary. And with continued weakness showing in the European economy and inflation nearly non-existent, it’s beginning to look pretty likely that something like that might be necessary by the ECB’s standards.
Since topping out at 1.1460 the morning after FOMC, EURUSD has put in three consecutive days of declines in a move that’s seen the pair drop by over 300 pips. But perhaps more interesting is what we’ve seen in positioning in the pair – which is - as the EUR/USD has continued dropping, retail traders have been closing shorts and getting long. As SSI is a contrarian indicator, when this reading flips long it can be a really attractive short signal. When this happened in 2014, EUR/USD staged a 3,000 pip movement lower. In the below chart, we’re looking at historical SSI (in red and green bars) extrapolated behind price (black line). Notice how inversely this has moved in the recent past – as growing short positions (in red) are often met with inclines in EUR/USD and growing long exposure (in green) is met with price declines.
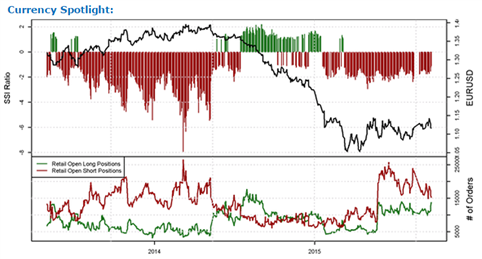
Taken from Speculative Sentiment Index, September 23rd 2015; prepared by James Stanley
This is noteworthy because as these declines have mounted in the EUR/USD, we’ve seen that retail trader exposure narrow to the point where it’s almost flipped long. As of right now, approximately 47% of retail traders are long in the pair, and if you want to follow this in real-time on your charts, any live FXCM account can get access to this indicator to do so free-of-charge. In the below chart, we’re looking at the current setup in EUR/USD. Notice how the short-term trend-line (that had previously made up the under-side of the short-term bear-flag) has been broken while the ‘bigger picture,’ longer-term bear-flag remains in play on the pair.

Created with Marketscope/Trading Station II; prepared by James Stanley
When SSI flips long, this can be a really attractive indication to look at the short-side EUR/USD play. While no indicator is predictive, trading on the other side of retail positioning can be an excellent way to incorporate a probabilistic-type of approach into your repertoire.
2. Chinese PMI prints at lowest level in six years: The Caxin Purchasing Managers’ Index printed at 47 versus an expectation of 47.5, with reads below 50 indicating contraction. This is the weakest PMI print in over six years, and for an industrial-based economy this is a vitally important data point as it’s indicative of manufacturing activities taking place within the economy. This is the sixth consecutive month in which Chinese PMI has printed below 50, and this highlights concerns that the 7% growth target for the economy will be difficult, if not impossible to attain. Chinese stocks sold off on the back of this missed PMI print, with the Shanghai Composite (shcomp) shedding -2.19% while the Shenzhen Composite (szcomp) dropped by -.83%.
Chinese President Xi Jinping kicked off his US-tour yesterday in Seattle, and he repeated a prior statement that China will be able to maintain medium to high growth. He also mentioned that China is committed to market-based reforms and that the country wanted to ‘modify, not overturn, the economic world order.’
This could possibly be seen as statements that the Chinese government will roll out additional stimulus measures should the contraction in the economy continue to swell. The slowdown is very real, and we’re starting to see this weakness throughout the Asian economy in data points like visitors to Macau from South Korea dropping by -25% in a year. It’s perilously difficult to try to stop these types of trends, because the risk is that measures to shore up the economy may actually make the situation worse.
We will likely see additional stimulus measures out of China, and we’ll probably see more reserve-requirement cuts (meaning that margin will be decreased so that banks can take on even more leverage as the economy (and investments) turns against them).
Stocks in Hong Kong put in a similar movement in the overnight session, with the Hang Seng dropping by -2.3% while Shanghai shed -2.2%. In the below chart, we’re looking at the same 22,000 level on the Hang Seng that we had mentioned previously, and notice the failed breakout attempt last week. This, along with the Yen could be one of the more attractive ways for westerners to trade the ‘growth slowdown theme.’

Created with Marketscope/Trading Station II; prepared by James Stanley
3. Stocks have held on, for now: After spending most of yesterday’s US session holding on to losses, the S&P 500 continued lower into the Asian session, bottoming out shortly after the Chinese open, establishing a near-term low at 1,921. But since then, stocks have clawed their way back up to prior Fibonacci and trend-line support at 1,950. This is an example in which old support may be coming in as new resistance in a down-trend.
Given the weakness seen yesterday before we ever got to the PMI print out of China would indicate that the issue here isn’t China, and is probably more related to the Federal Reserve and the confusion that’s come about because of the ‘hawkish-hold’ that the bank gave markets at the September meeting.
On the below chart of the SPX500, we’re looking at recently-broken trend-line support to go along with a Fibonacci retracement that’s been seeing significant price action of late. This Fibonacci retracement can be drawn by taking the high at 2,137 and drawing down to the ‘panic lows’ of 8/24 (shown on the below chart, in blue).

Created with Marketscope/Trading Station II; prepared by James Stanley
Written by James Stanley of DailyFX; you can join his distribution list with this link, and you can converse with him over Twitter @JStanleyFX.