


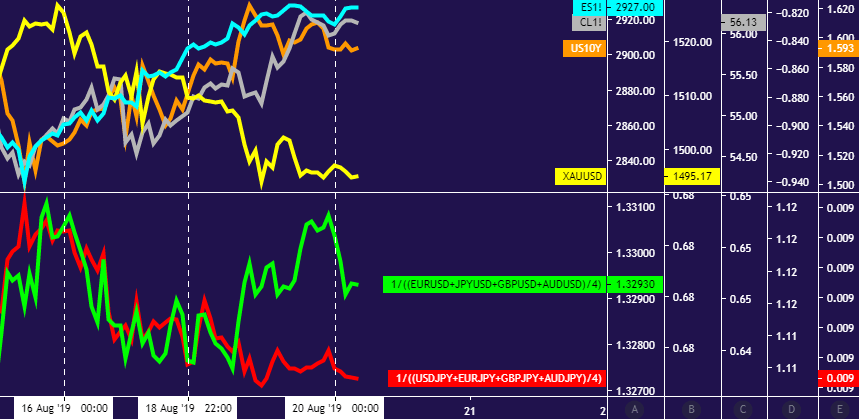
Crude oil, gold price performance chart created using TradingView
CRUDE OIL & GOLD TALKING POINTS:
- Crude oil prices edge up in risk-on trade, but key resistance held
- API inventory flow data rounds out barebones economic calendar
- Gold prices retreat as markets eye FOMC minutes, Jackson Hole
Friday’s risk-on sentiment tilt carried through Monday’s session, with crude oil prices rising alongside stocks. A parallel rise in bond yields undermined the appeal of non-interest-bearing assets and weighed on gold. Impressively, the US Dollar recovered some lost ground despite its recently anti-risk profile.
All the same, the benchmark commodities made little progress from near-term ranges, as expected. That seems to reflect traders withholding conviction ahead of critical event risk: minutes from July’s FOMC and ECB meetings as well as the Fed-hosted economic symposium in Jackson Hole, Wyoming.
The weekly API inventory flow report rounds out the barebones data docket. It will be sized up against expectations of a 1.22-million-barrel drawdown in US stockpiles expected to be reported in official EIA statistics due Wednesday. Absent dramatic deviation, a strong response from prices seems unlikely.
Get our free guide to help build confidence in your gold and crude oil trading strategy !
GOLD TECHNICAL ANALYSIS
Gold prices edged lower toward swing low support at 1480.00. A daily close below that would bolster topping cues hinted in negative RSI divergence, exposing a more substantive barrier in the 1437.70-52.95 zone next. Swing high resistance is at 1535.03, with a weekly chart inflection level at 1563.00 lining up thereafter.
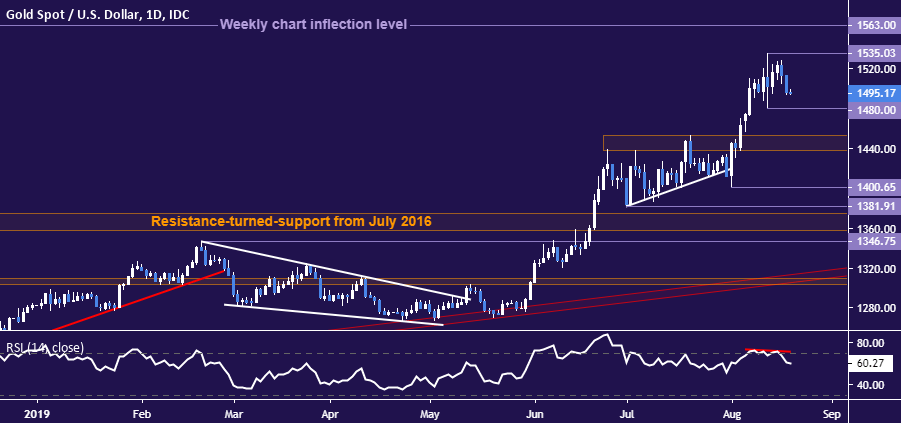
Gold price chart created using TradingView
CRUDE OIL TECHNICAL ANALYSIS
Crude oil prices remain pinned below resistance capping gains since late April, now at 58.30. A daily close above that targets the 60.04-84 zone. Alternatively, a move below the congestion area running down through 53.95 sets the stage to challenge support near the $50/bbl figure once again.
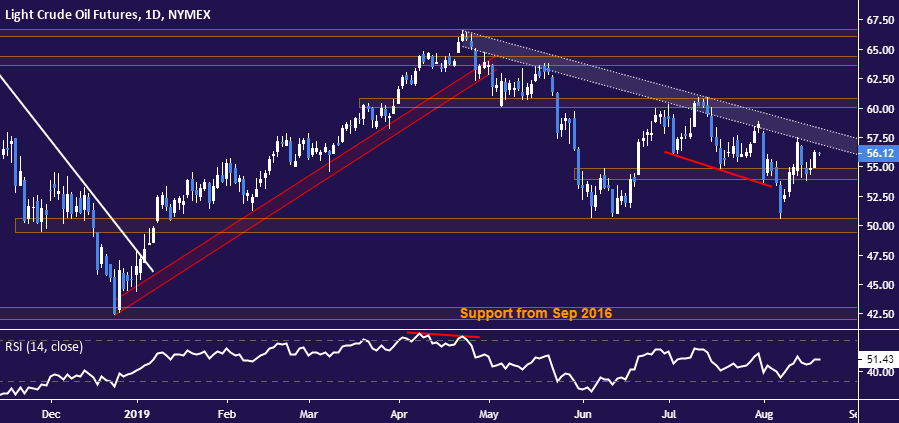
Crude oil price chart created using TradingView
COMMODITY TRADING RESOURCES
- See our guide to learn about the long-term forces driving crude oil prices
- Having trouble with your strategy? Here’s the #1 mistake that traders make
- Join a free webinar and have your commodity market questions answered
--- Written by Ilya Spivak, Currency Strategist for DailyFX.com
To contact Ilya, use the comments section below or @IlyaSpivak on Twitter


