


Talking points:
- This is the fifth part of our support and resistance series.
- In the first three parts, we looked at static support and resistance, Fibonacci, and price action.
- In our last article, we examined stop placement and risk management with this analysis.
In our last article, we looked at how traders can use Support and Resistance to manage risk in their trading operations.
This is, in-and-of-itself, a huge part of trading. After all – the future is unpredictable and most traders will never be able to completely control a market (with the ability to push prices higher or lower). The only decision that’s truly in a trader’s control is when they buy and when they sell (along with how they do it).
In this article, we’re going to delve into the topic of entering positions using support and resistance analysis.
Support/Resistance is Theoretical
As we explained in our last article, when prices run down to support or up to resistance the premise that price action may reverse is simply a theory that the near-term trend might change.
It doesn’t mean that this will happen. It’s simply a theory, or idea, or hypothesis that a reversal may be afoot.
The big benefit of this analysis comes from the fact that these price levels give traders areas that they can look to for the placement of their stops; so that if a reversal doesn’t happen, they can mitigate the loss of the idea that didn’t work out. And if a reversal does, in-fact, take place, then they can potentially look to reap far more on the reward side than they would’ve lost if the idea didn’t work out.
As we had looked at in our last article, placing stops around support and resistance allows the trader to actively look to avoid The Number One Mistake that Forex Traders Make: Which is taking such large losses when they are wrong along with small wins when they’re right.
But this doesn’t necessarily tell the trader when or how to enter.
Using Support and Resistance to Trigger and Initiate Positions
There are quite a few ways that this can be done, and once again the ‘best’ way really boils down to the trader’s individual personality and risk tolerance.
The very act of price action validating a support or resistance level shows us that something may happen. Traders can look for long wicks on a candle to highlight a market’s reaction once a certain level is reached.
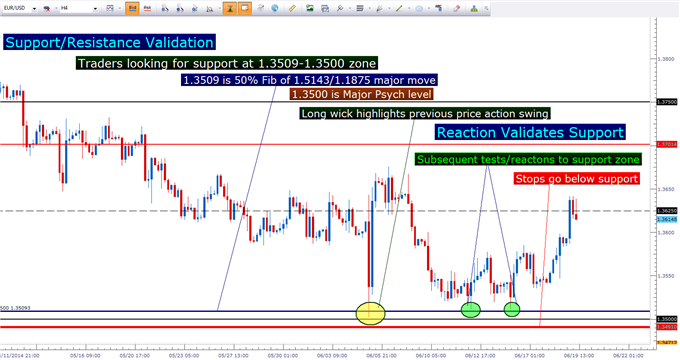
The very fact that this long wick exposes a market’s reaction to a particular level can give the trader enough motivation to open (trigger) the position; in anticipation of that reaction to the support level turning into a new trend.
But this can be taken a step further in price action analysis; looking for ‘formations’ that may exhibit reversal qualities.
The Pin Bar, which is short for ‘Pinocchio Bar,’ is probably one of the more exciting. We looked at these formations in the article, Price Action Pin Bars. The pin bar is a single candle formation that shows that a reversal may be in order. A pin bar requires a wick that is at least as large as the candle body, with the wick ‘sticking out’ from recent price action.
The theory behind the pin bar is that as a market jumps to a new high, or new low traders jump on the opportunity to fade the move (trade it in the opposite direction). This creates a reversal in the market that may last for an extended period of time.
But there are numerous other price action entry methods that can be used to look for near-term reversals. We went over many of these bearish price action signals in the article, Trading Bearish Reversals; and many of their bullish brethren in the article The Hammer Trigger for Bullish Reversals.
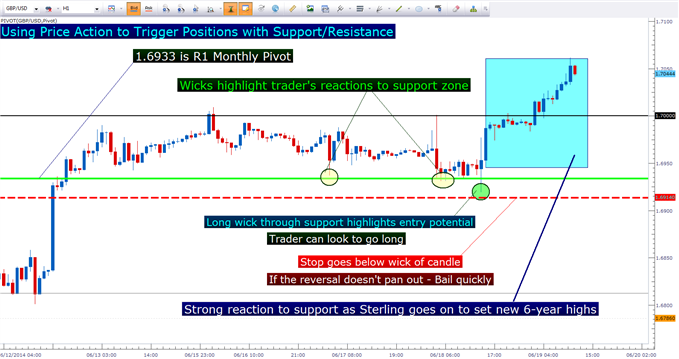
But a static formation isn’t even required to trigger positions if prices are sitting at support and/or resistance and showing wicks highlighting reactions. The simple fact that prices are unable to trade lower below support (or higher above resistance) could be motivation enough for traders to initiate new trades.
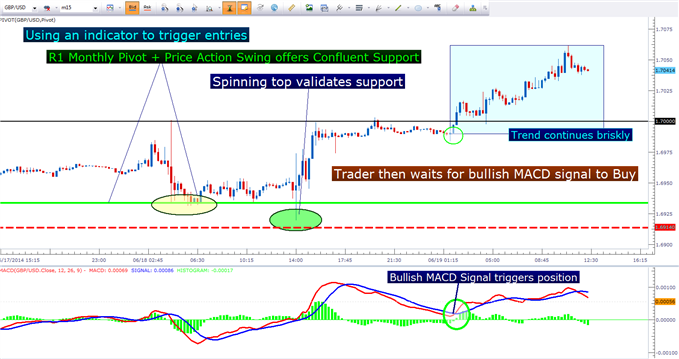
In the example below, we see how a confluent support level on GBPUSD offered entry possibility after a spinning top (highlighted by the green circle) reacted to the confluent zone of support that was previously validated by price action.
We looked at how traders can use indecisive price action such as Dojis and Spinning Tops in the article, The Most Important Price Action Formation is Indecision.
But price action isn’t the only way to trade support and resistance.
Triggering Positions with Indicators
When prices run into support or resistance, the trader simply has an idea that a near-term reversal may be possible. This can afford that trader to look for favorable risk-reward ratios (in which the trader stands to profit more than they have to put up at risk).
Traders can use indicators to time entries in the direction of those anticipated movements. Popular options for this job include Relative Strength (RSI), Stochastics, and Moving Average Convergence/Divergence (MACD).
Let’s say, for instance, that our trader wants to use a MACD trigger to initiate positions, which we discussed in the article MACD as an entry trigger.
The trader can wait for support or resistance to be hit in a market, and once this takes place they can pull up the indicator to wait for the appropriate signal.
Let’s walk through an example together to illustrate how this can be done.
A trader notices that GBPUSD just ran into a support level at 1.6933 that they’d been watching on their chart. This level is the R1 monthly pivot, as well as offering a previous price action swing in the same 1.6933 support zone. This is a ‘confluent’ level of support since there are multiple studies pointing to the fact that prices may resist at this level.
After 1.6933 gets hit in GBPUSD, the trader simply pulls up MACD (and this can be done on a shorter-term chart which we’ll explain in the next section) and waits for a bullish signal to initiate the position. Once the position is triggered, the stop goes on the other side of support and the trader looks to profit by at least the amount risked.
Using Multiple Time Frames to be More Active
A natural question that comes up after learning to use indicators for entries when support or resistance is met in a market is which time frame should be used for the entry indicator.
Once again, this boils down to personal preference without any one ‘right’ answer being out there.
The trader can use the same time frame that they’re using to identify support and resistance, but the downside is that by the time the indicator signals an appropriate entry, the proverbial train may have already left the station.
To be more active, traders can implement multiple time frame analysis. This will enable the trader to dial down to a lower time frame once support or resistance gets hit in a market. This lower time frame can enable the indicator to be considerably more active, offering many more signals than what might be seen on the longer time frame. We covered the topic of Multiple Time Frame Analysis in the article, The Time Frames of Trading.
The faster the time frame that is being used to trigger into the trade, the more active the indicator will be (and the more potential entries the trader can see). This isn’t necessarily only a good thing; as the more active indicator will also, in general, offer less-reliable signals as the shorter time frames introduce more noise and volatility into each individual candle since so much less information goes into each.
Once again, the ‘best’ way to go about instituting multiple time frame analysis is based on each individual trader’s personality and risk tolerance. More aggressive traders are usually going to be best served by using faster entry time frames (with which they may see more stops but larger risk-reward potential), while conservative traders are often best served by slower entry time frames offering more consistent, albeit fewer, entry signals.
In our next article, we’ll look at how traders can take support and resistance analysis to the next step in managing trades, building positions, and taking profits out of winners while keeping a piece of the position on to look for more upside.
--- Written by James Stanley
Before employing any of the mentioned methods, traders should first test on a demo account. The demo account is free; features live prices, and can be a phenomenal testing ground for new strategies and methods. Click here to sign up for a free demo account through FXCM.
James is available on Twitter @JStanleyFX
Are you looking to take your trading to the next level? The DailyFX 360° Course offers a full curriculum, along with private, weekly webinars in which we walk traders through dynamic market conditions using the education taught in the course.
If you’d like a customized curriculum based on your current experience level, our Trader IQ course via Brainshark can offer assistance. Please click on the link below to complete our Trader IQ questionnaire.
Would you like to trade alongside seasoned professionals throughout the trading day? DailyFX On Demand gives you access to DailyFX Analysts during the most active periods of the trading day.
Would you like to enhance your FX Education? DailyFX has recently launched DailyFX University; which is completely free to any and all traders!


