
GOLD AND NASDAQ 100 OUTLOOK:
- Gold prices advance on Monday, supported by U.S. dollar weakness and falling Treasury yields
- Meanwhile, the Nasdaq 100 slides on cautious market sentiment ahead of key corporate earnings, with Microsoft and Alphabet releasing quarterly results on Tuesday
- This article looks at key tech levels to watch in the Nasdaq 100 in the coming days

Most Read: S&P 500 Week Ahead Forecast - MSFT, GOOGL, AMZN and META Earnings to Guide Markets
Gold prices (XAU/USD) rose slightly at the start of the week, supported by a weaker U.S. dollar and falling Treasury yields, but gains were limited as traders continued to fret over the Fed’s policy outlook, with Wall Street expectations in a state of flux in recent days. Against this backdrop, XAU/USD was up 0.3% to $1,995 in afternoon trading, although it was unable to trim most of last Friday's losses, when hawkish comments from central bank officials triggered a sharp sell-off in the precious metal.
While gold has broken below the $2,000 threshold and retrenched more than 3% from its April high, it retains a bullish profile over the medium term. With the U.S. economy slowing down and key market indicators flashing recession signals, it is only a matter of time before the FOMC officially ends its tightening campaign. Once this happens, rates are likely to start falling more quickly as traders attempt to front-run the easing cycle. This should create a benign environment for precious metals.
Related: Euro Stoxx 50, UK FTSE 100 - What Are Breadth Indicators Telling Us About the Trend?
Elsewhere, the Nasdaq 100 took a turn to the downside on Monday after a near flat performance on Friday, falling more than 0.7% in late trading in New York amid cautious sentiment ahead of key corporate earnings. With several large-cap tech giants expected to release their quarterly results this week, including Microsoft and Alphabet on Tuesday, many traders are on the sidelines waiting to analyze Corporate America's outlook before committing additional capital to risk assets.
The Nasdaq 100 is up more than 20% from its January lows, so much of the good news is already reflected in the price. This means that earnings from the big tech will have to surprise to the upside by a wide margin to reignite upside momentum and keep the rally going; otherwise, bulls could start bailing in droves, setting the stage for a significant pullback in the near term.
Focusing on Alphabet and Microsoft, the former is seen posting earnings per share of $1.08 on revenue of $68.87 billion, while the latter is forecast to report EPS of $2.24 on sales of $51.12 billion. For a more complete list of upcoming corporate reports, check out DailyFX’s new Earnings Calendar.
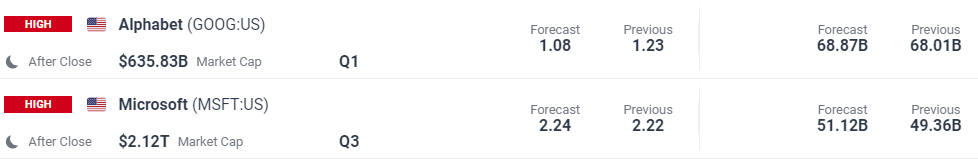
Source: DailyFX Earnings Calendar

NASDAQ 100 TECHNICAL OUTLOOK
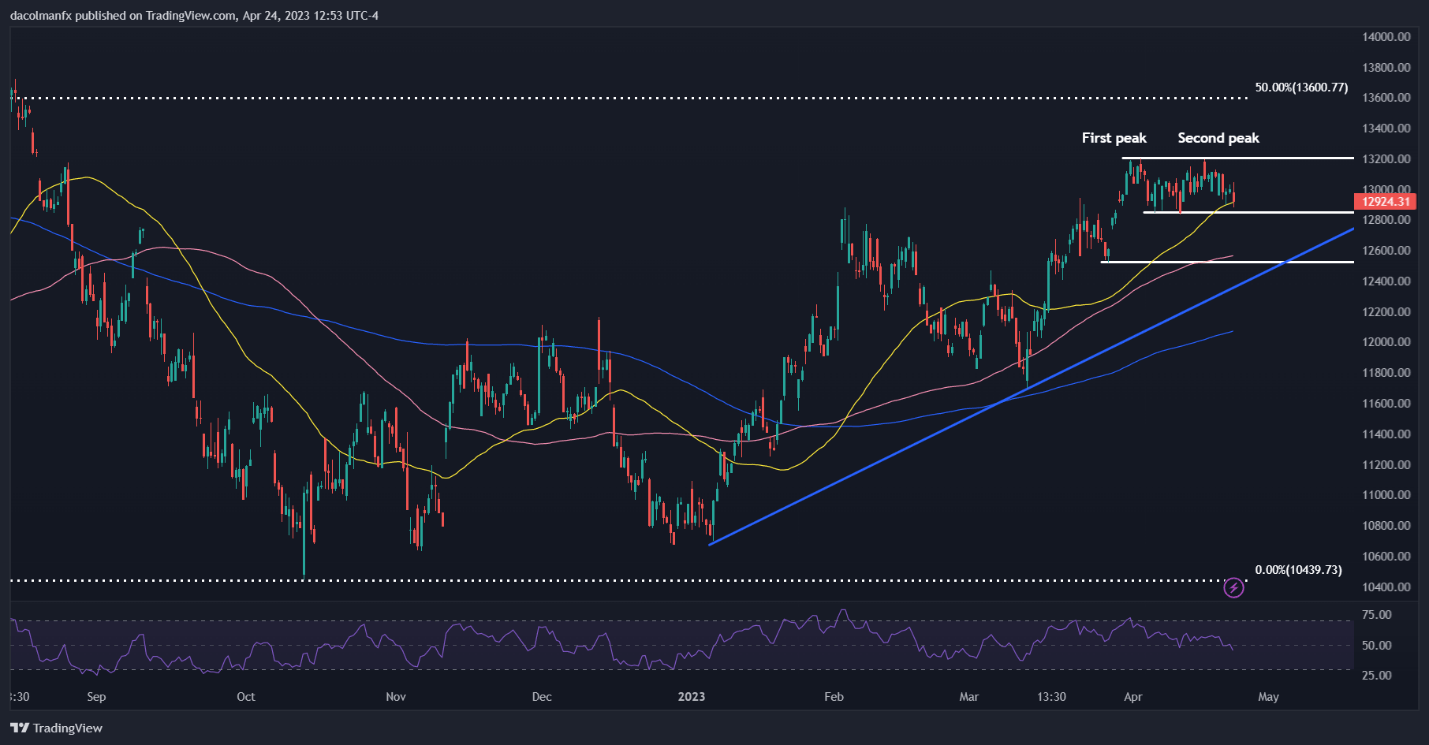
From a price action perspective, the Nasdaq 100 entered a bull market earlier this month after climbing more than 20% from its 2023 lows. While this development is in itself positive, caution is warranted as prices have been forging a bearish double-top pattern recently, an ominous signal for the tech benchmark.
If the double top is validated, the Nasdaq 100 could be in for a steep drop, with a retest of the 12,500 level potentially coming into play. In terms of technical signals to watch, the bearish configuration would be confirmed with a break below support at 12,835.
On the other hand, if prices pivot higher and resume their advance, initial resistance appears at 13,200. A move above this barrier would invalidate the double top, paving the way for a rally towards 13,610, which corresponds to 50% of the Fibonacci retracement of the November 2021/October 2022 slump.
NASDAQ 100 TECHNICAL CHART