


Euro Stoxx 50, UK FTSE 100 - Price Outlook:
- 92% of the members in the Euro Stoxx 50 index are above their respective 250-DMAs.
- 91% of the members in the UK FTSE 100 index are above their respective 20-DMAs.
- What does it mean for the direction of the two indices?

Improving market breadth points to further gains in the Euro Stoxx 50 and the UK FTSE 100 index in the coming weeks/months.
As of Friday, 92% of the members in the Euro Stoxx 50 index were above their respective 250-day moving averages. Data from 2002 onwards suggests that when 91%-93% of the members were above their respective 250-DMAs, the index has been up 74% of the times over the subsequent 120 days. That is, in such instances, 74% of the times the index returns have been positive over a four-month period, based on historical performance (the distribution plot).
Distribution plot of Euro Stoxx 50 index returns
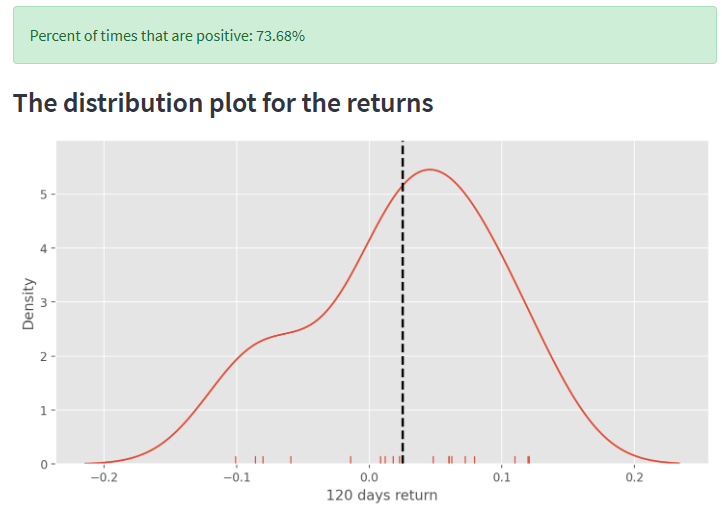
Data Source: Bloomberg; Chart Created by Manish Jaradi in Python
As of Friday, 91% of the members in the UK FTSE 100 index were above their respective 20-day moving averages. Data from 2002 onwards suggests that when 90%-92% of the members were above their respective 20-DMAs, the index has been up 63% of the times over the subsequent 30 days. That is, in such instances, 63% of the times the index returns have been positive over a one-month period, based on historical performance (the distribution plot).
Distribution plot of UK FTSE 100 index returns
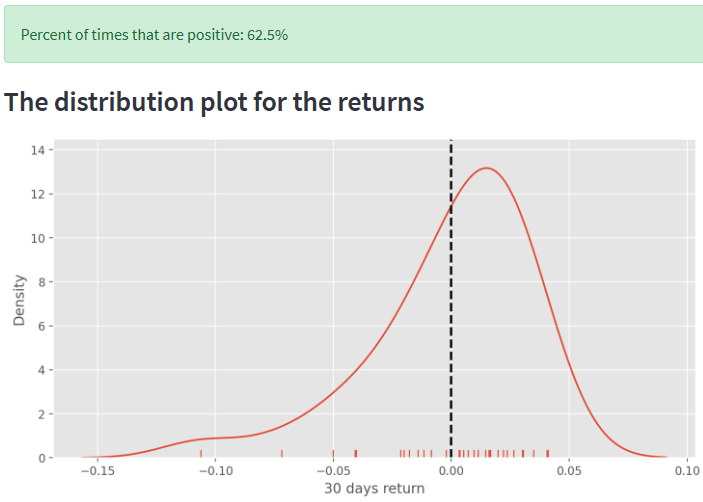
Data Source: Bloomberg; Chart Created by Manish Jaradi in Python
Trade Smarter - Sign up for the DailyFX Newsletter
Receive timely and compelling market commentary from the DailyFX team
--- Written by Manish Jaradi, Strategist for DailyFX.com
--- Contact and follow Jaradi on Twitter: @JaradiManish


