


WTI Crude Oil (CL1!) News and Analysis
- WTI prices test Biden’s SPR price range target
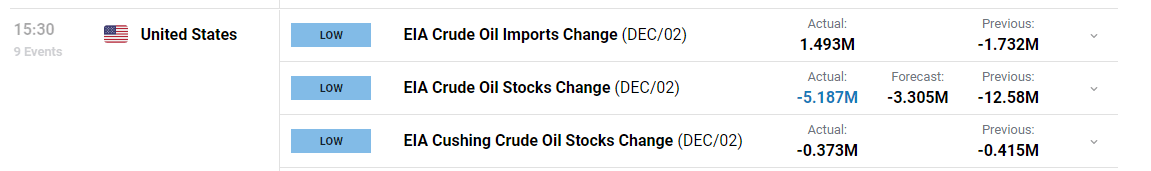
- EIA data reveals greater draw of crude stocks last week
- WTI crude oil technical considerations including the artificial price floor ($67-$72)
- The analysis in this article makes use of chart patterns and key support and resistance levels. For more information visit our comprehensive education library

WTI Approaches Biden’s Price Range for SPR Refill
The Biden administration previously announced that the special petroleum reserves (SPR) are set to be replenished between a price range of $67-$72, a level that crude oil prices have now tested. The purchase of oil to replenish SPR stocks is likely to set an artificial price floor for WTI, particularly when accounting for the May announcement that as much as 60 million barrels is to be purchased next year at lower prices. Seeing that we are getting closer to 2023 by the day, WTI participants will certainly be keeping a close eye on prices from here on out.
The purchases are more likely to be made in tranches over time in an attempt to maintain orderly market conditions, which suggests a more gradual price floor emerging as opposed to a missive spike higher on a single purchase.

EIA Data Reveals Larger Draw than Expected
The Energy Information Agency (EIA) reported storage data for the week ending on the 2nd of December, which showed a greater draw on stocks than anticipated. The 5.2 million barrel decline outpaced the -3.3 million barrel forecast which supports crude valuations for the time being.
Customize and filter live economic data via our DailyFX economic calendar
WTI Crude Oil Technical Analysis
WTI Crude prices have witnessed a sizeable drop throughout H2 thus far, dropping below multiple levels of support and Fibonacci retracement levels on the way down. Price action has more recently dipped below the 78.6% retracement of the 2021-2022 major move at $77 and borders the upper level of the Biden administration’s $67-$72 range. Price action appears to be respecting this level but that is not to say prices can’t head toward $67 in the interim.
Momentum appears in check via the MACD indicator and the RSI has yet to enter oversold conditions, suggesting that further downside remains a possibility despite the artificial floor. Support comes in at $72, $67 and $62 (full Fib retracement). Resistance remains at $77, followed by $88.40.
WTI Crude Oil Futures (CL1!) Daily Chart
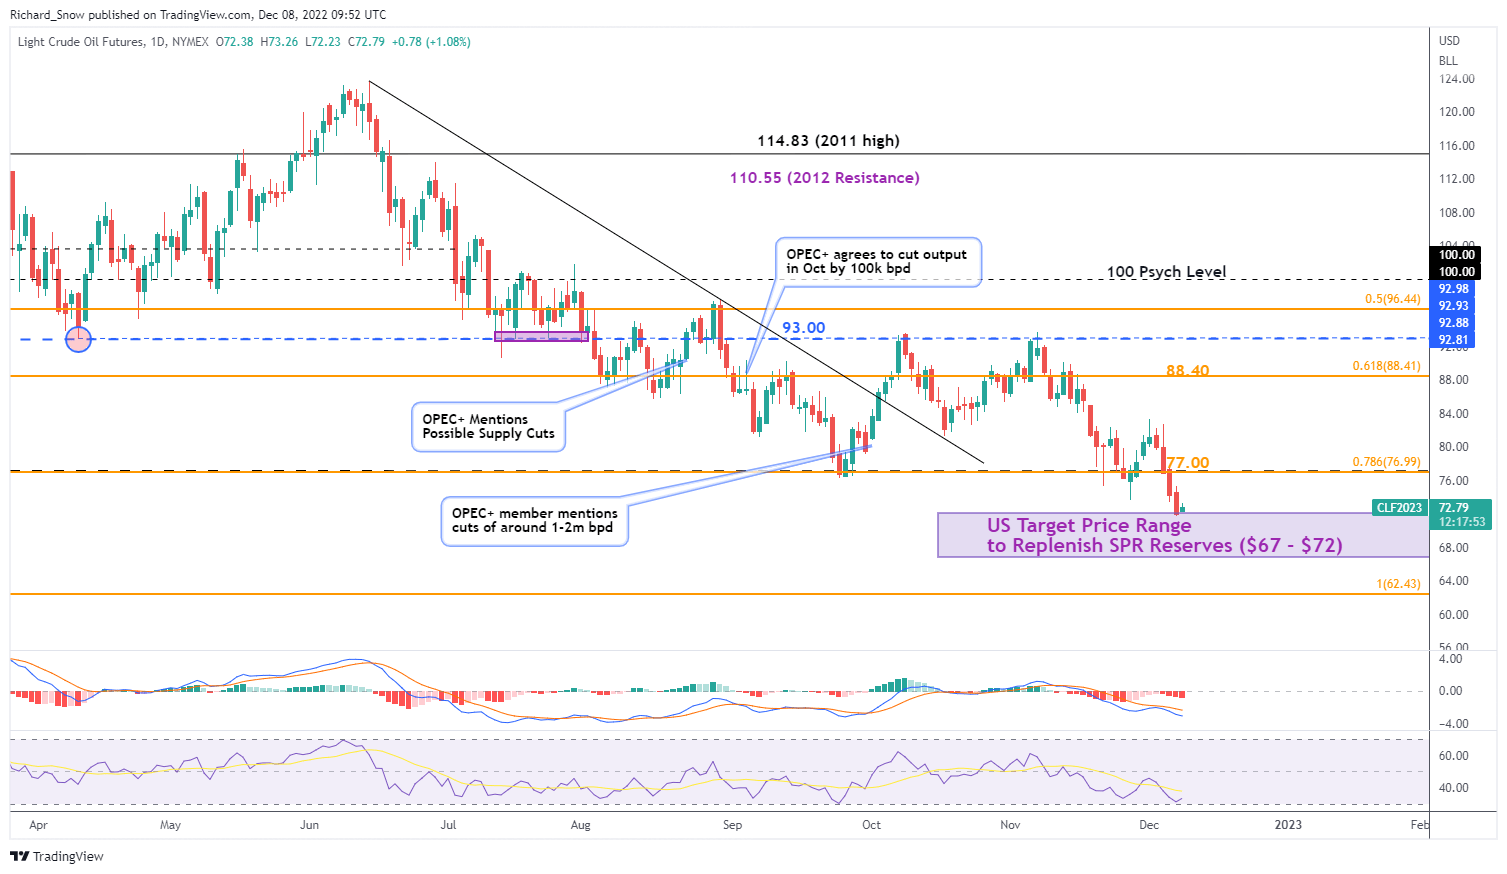
Source: TradingView, prepared by Richard Snow
--- Written by Richard Snow for DailyFX.com
Contact and follow Richard on Twitter: @RichardSnowFX


