


USD/CAD Vulnerable to Further Losses Below 1.3500
- Canadian Dollar buoyed by USD weakness - USD/CAD falls.
- USD/CAD stumbles to support while psychological resistance firms.
- Economic data continues to drive sentiment with price action vulnerable to event risk for the remainder of the week. FOMC Minutes reiterate the Fed’s commitment to taming inflation as Friday’s NFP's take center stage.

USD/CAD has moved lower after bulls failed to drive prices back above key psychological resistance holding firm at 1.3700.
Although US Dollar strength underpinned gains throughout last year, the safe-haven greenback has provided a brief reprieve to the Loonie.
With the major currency pair reaching a high of 1.36851 in yesterday’s session, bullish momentum has subsided. As USD/CAD stumbles to trendline support at 1.3477, the 1.3500 handle could prove to be an important zone of support and resistance for both the short and longer-term move.
USD/CAD Daily Chart
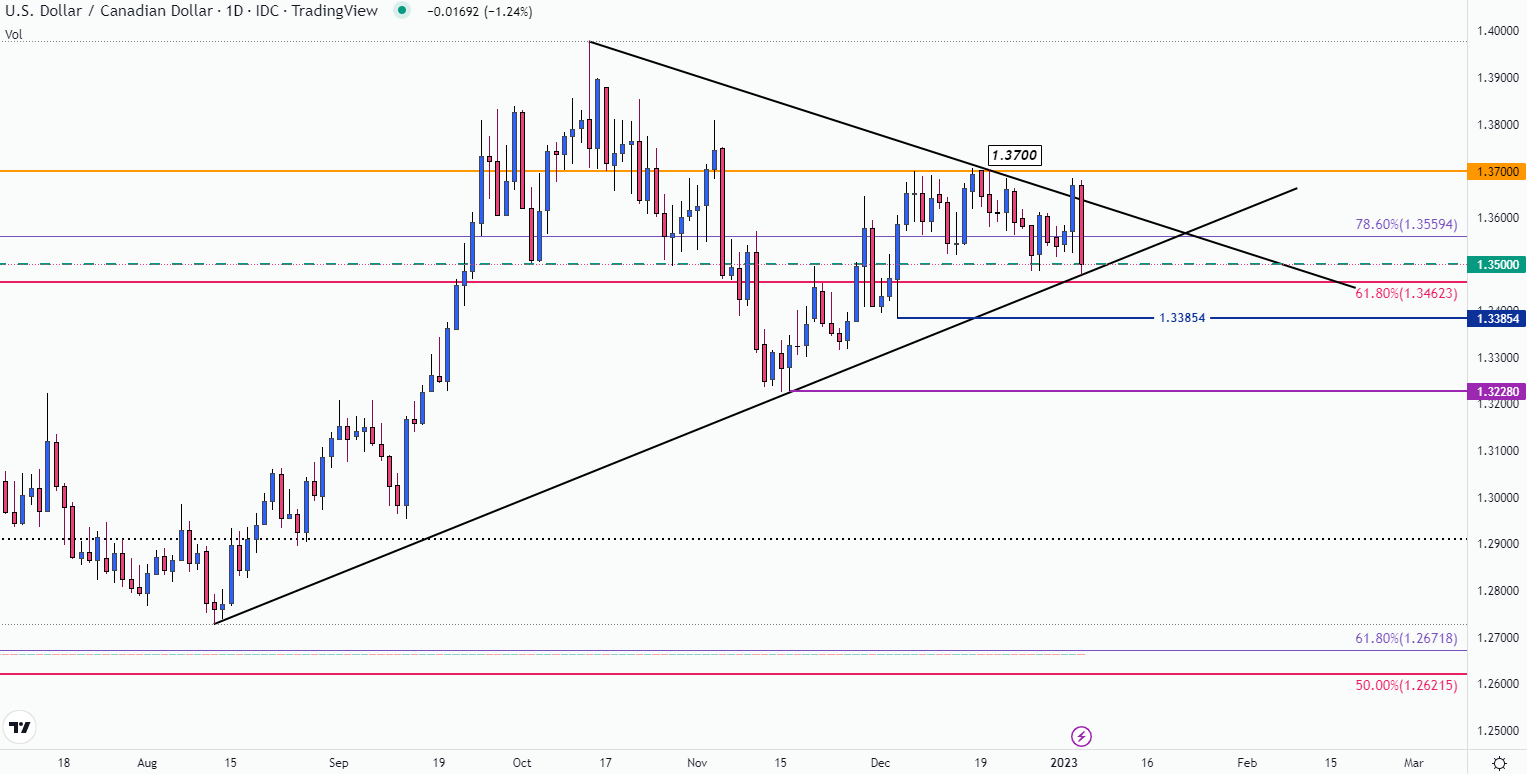
Chart prepared by Tammy Da Costa using TradingView
USD/CAD Face Additional Headwinds with Employment and NFP Data on Tap: Can Bears Break Support?
As market participants digest the December Fed meeting minutes, the economic docket could provide an additional catalyst for price action. While Friday’s NFP (non-farm payroll) report and Canada’s employment data take center stage, investors will likely continue to monitor the reports closely.
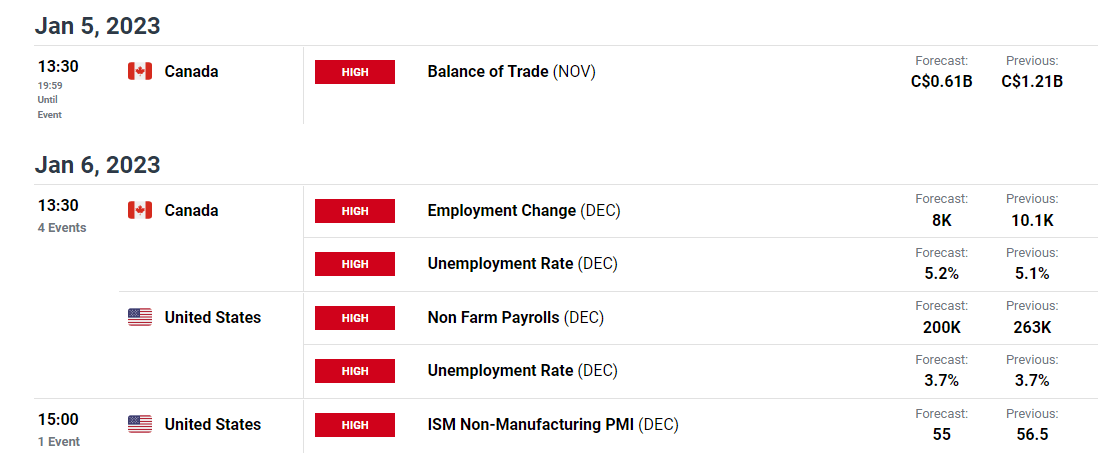
DailyFX Economic Calendar
While interest rate expectations and recession risks continue to drive sentiment, Fibonacci levels from historical moves have supported the recent move.

With the 78.6% Fibonacci retracement from the 2011 – 2016 move providing imminent resistance at 1.3559, the 61.8% retracement of the historical move has formed an additional barrier of support around 1.3462.
USD/CAD Weekly Chart
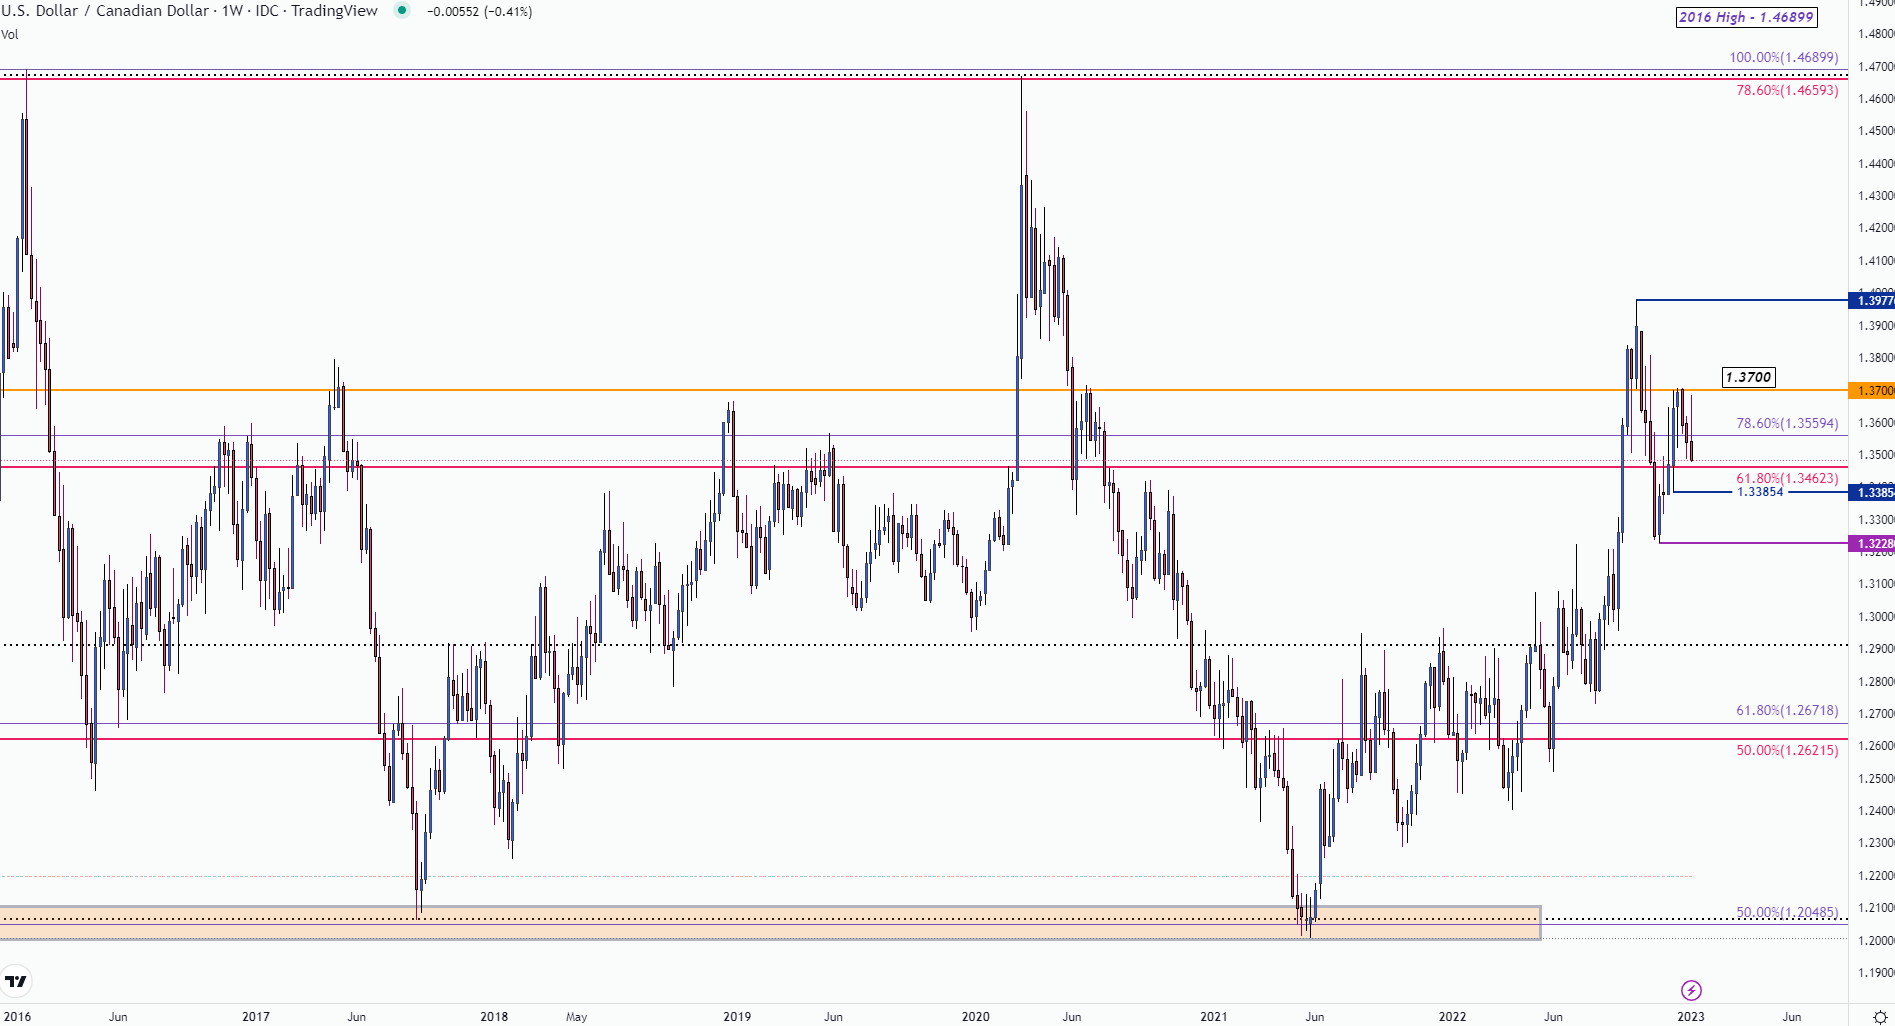
Chart prepared by Tammy Da Costa using TradingView
If bears manage to drive prices below this level and below 1.3385, the November low could come back into play at 1.3228 opening the door for further declines.
--- Written by Tammy Da Costa, Analyst for DailyFX.com
Contact and follow Tammy on Twitter: @Tams707


