


S&P 500, Nasdaq 100 Outlook:
- S&P 500 falls to support at prior resistance as rate expectations spook equities
- Nasdaq 100 dips below 12500 after steep pullback from 12950.
- USD steadies after strong NFP report drives yields higher.

S&P 500, Nasdaq 100 Disheartened by Rate Expectations & USD Strength
US stock indices have continued to trade lower after Friday’s NFP (non-farm payrolls) report sent shivers through the equity market. As the unemployment rate fell to 3.4% (down from 3.5%), an additional 517k jobs were added to the US economy last month (far above the estimated 187k).
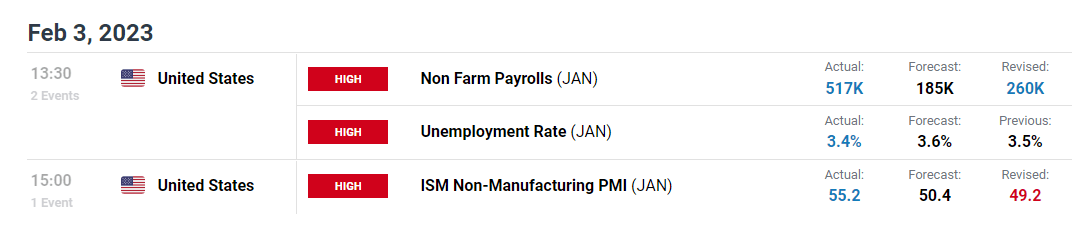
DailyFX Economic Calendar
Although the data reflects a resilient economy, it also presents the opportunity for the Federal Reserve to continue to hike interest rates more aggressively.
This places pressure of stocks which have a negative correlation (move in the opposite direction) to rate expectations which favors higher yielding assets.
S&P 500 Technical Analysis
While a softer 0.25% rate hike at last week’s FOMC helped drive S&P futures to a high of 4208.5, the resurgence of USD strength has pushed prices back towards prior resistance at 4110. From the daily chart below, the same level capped the upside move at the beginning of December and held the upper wick of the candlestick on 27 Jan.
S&P (US 500) Futures Daily Chart
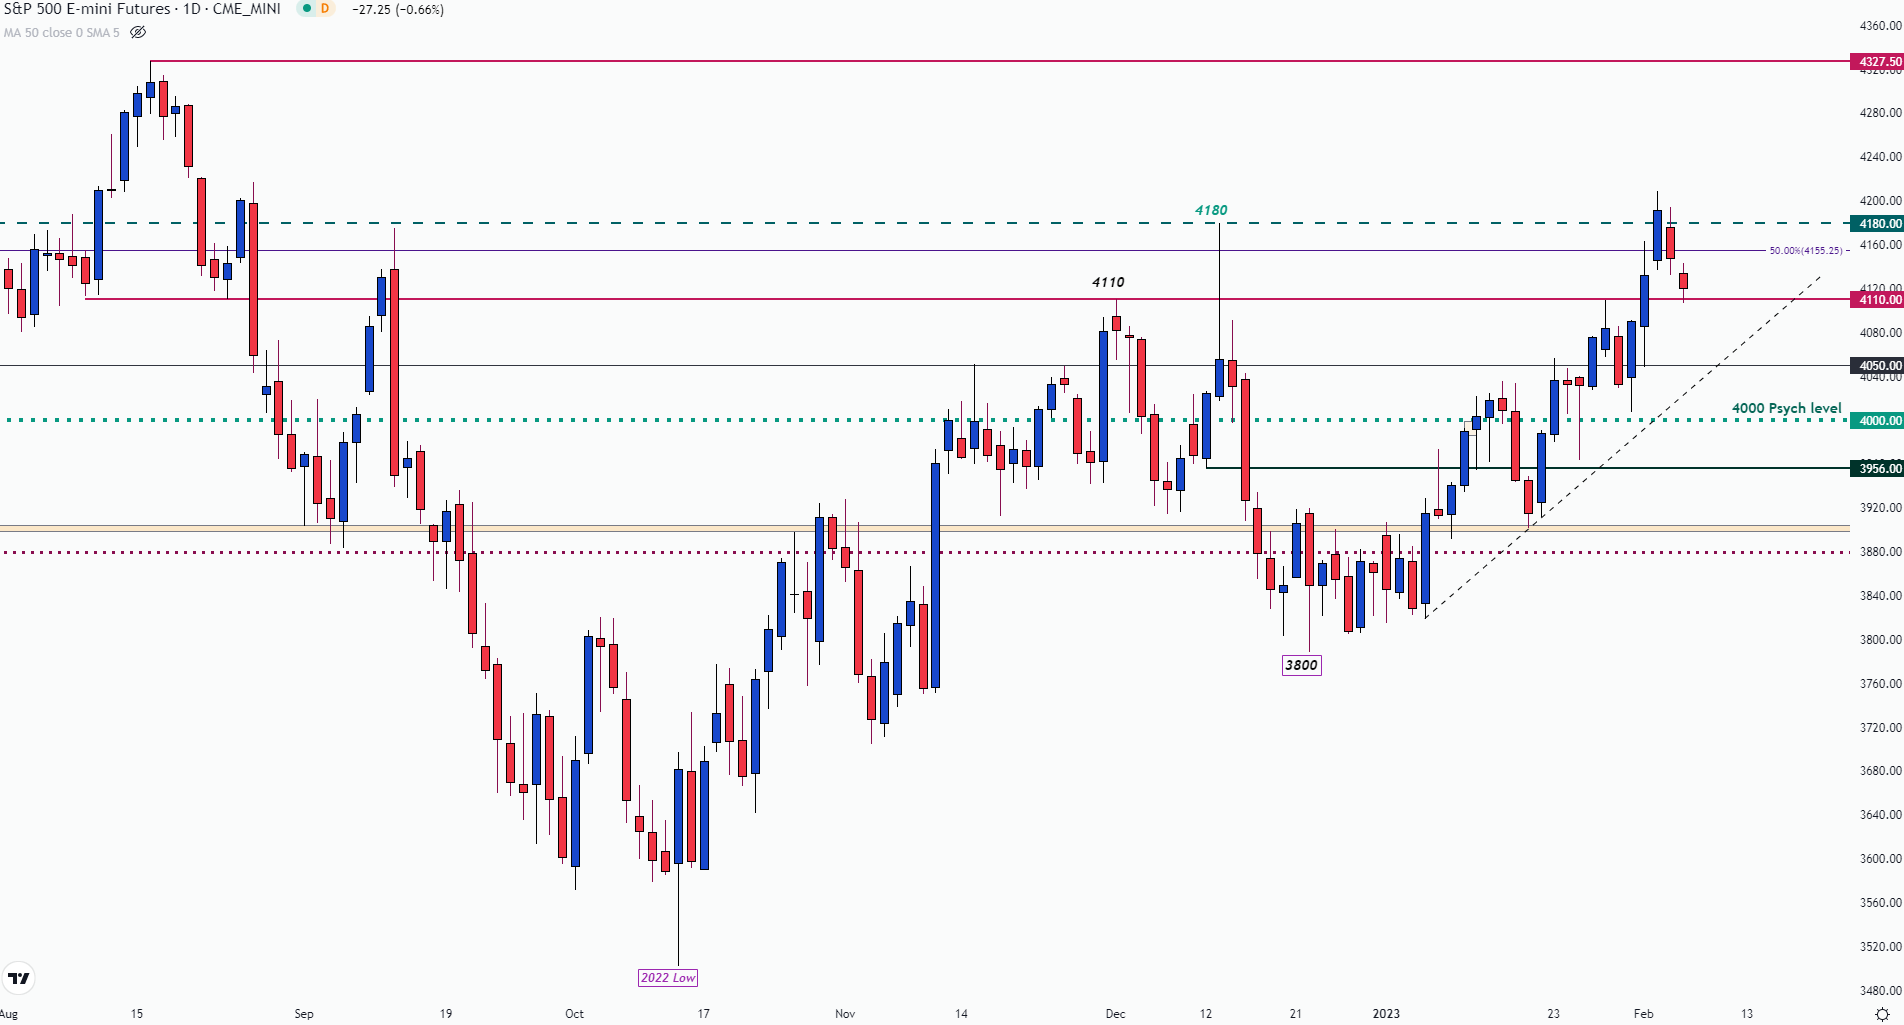
Chart prepared by Tammy Da Costa using TradingView
With support at prior resistance, a move lower could open the door for the next zone of psychological support at 4000. Meanwhile, the midpoint of the 2022 move has stepped in as immediate resistance around 4155. If bulls break through this barrier, the December 13 high holds at 4180 with a move higher bringing 4200 back into play.

Nasdaq 100 Technical Analysis
For Nasdaq 100 futures, failure to gain traction above 12950 allowed bears to pressure the uptrend, forcing prices below 12500. With the 12950-handle limiting prior historical moves (last year June and September), this could prove to be a difficult hurdle for bulls.
Nasdaq 100 (US Tech) Daily Chart
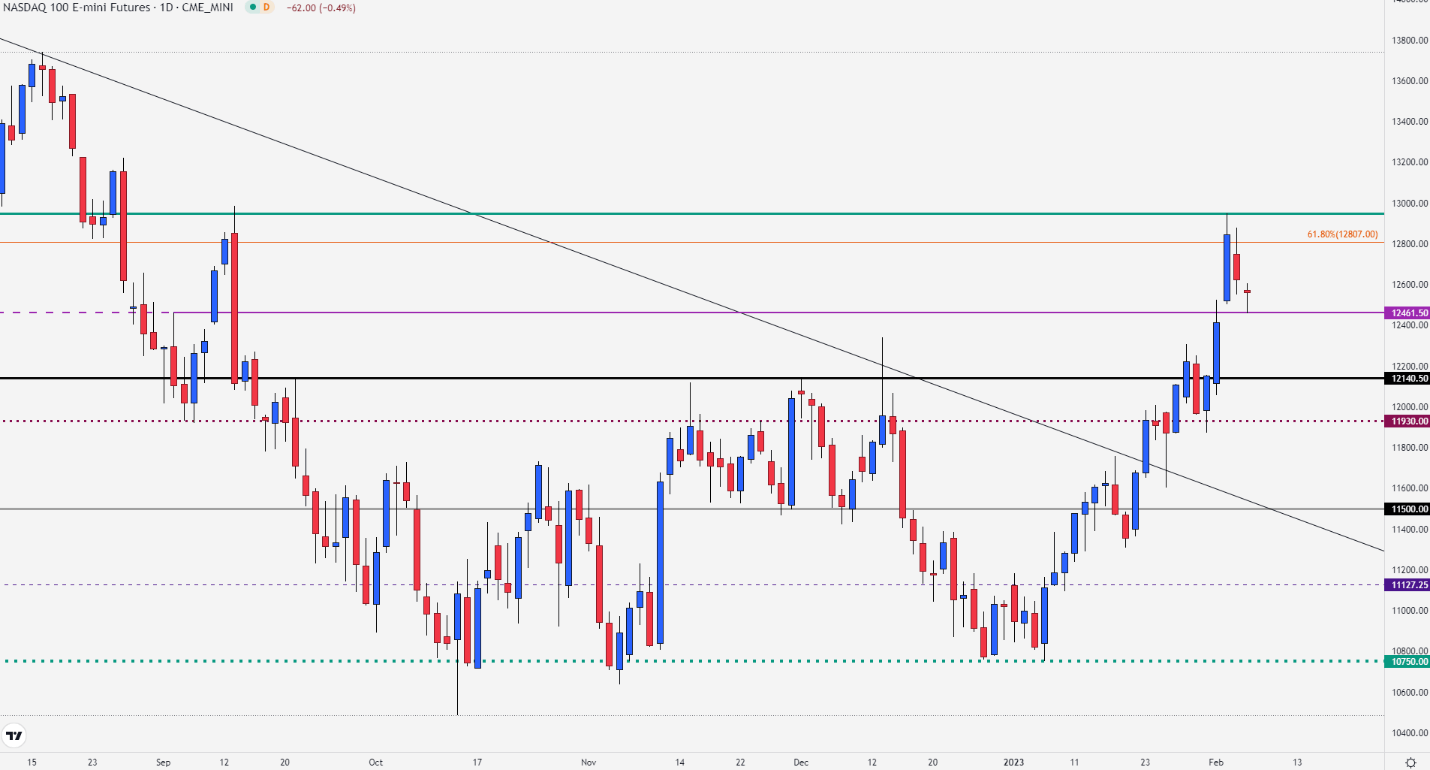
Chart prepared by Tammy Da Costa using TradingView
If sellers push below the December high of 12339, the next level of support could hold at the November high of 12145.

--- Written by Tammy Da Costa, Analyst for DailyFX.com
Contact and follow Tammy on Twitter: @Tams707


