


US Dollar (DXY) Price, Chart, and Analysis
- US core PCE nudge 0.1% lower to 4.6% in February.
- The US dollar slips but price action is muted for now.

Inflation in the US is falling, according to the latest data from the Bureau of Economic Analysis(BEA). Core PCE (ex-energy and food) fell to 4.6% in February, compared to 4.7% in January, while the PCE price index fell to 5.0% compared to a revised 5.3% in January. The BEA PCE data is the Federal Reserve's favored measure of inflation.
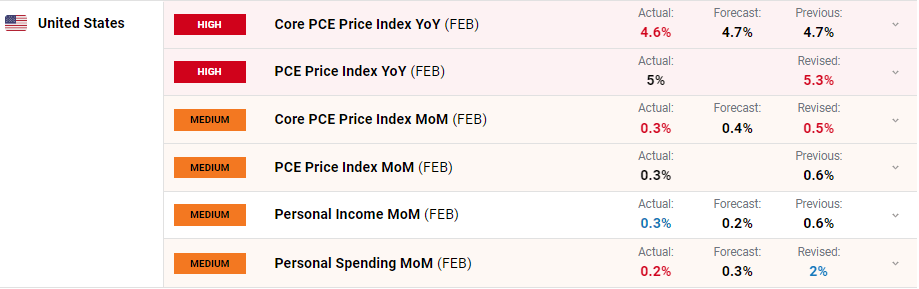
For all market-moving data releases and economic events see the real-time DailyFX Calendar.
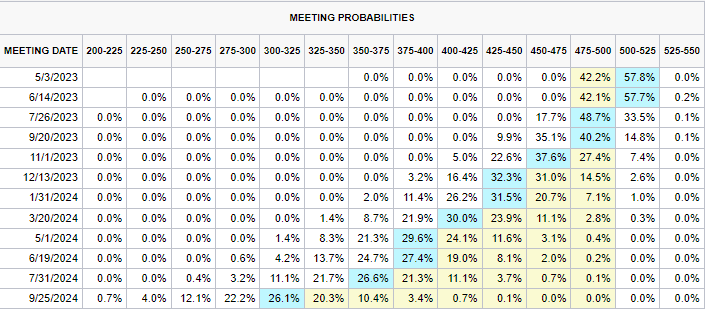
The US dollar slipped post-release while risk markets gained a small bid ahead of the opening bell in the US. Today’s release will please the Fed in their fight against stubbornly high inflation and may give them a chance to pause hiking interest rates. The market is currently pricing in a near 50/50 chance of just one more 25bp rate hike before the central bank pauses. The Fed is then seen cutting rates at the end of Q3 going into Q4.
The US dollar index (DXY) slipped around 15 pips after the release and is now less than half-a-point away from last Thursday’s multi-week low (101.50).
US Dollar Index Daily Chart
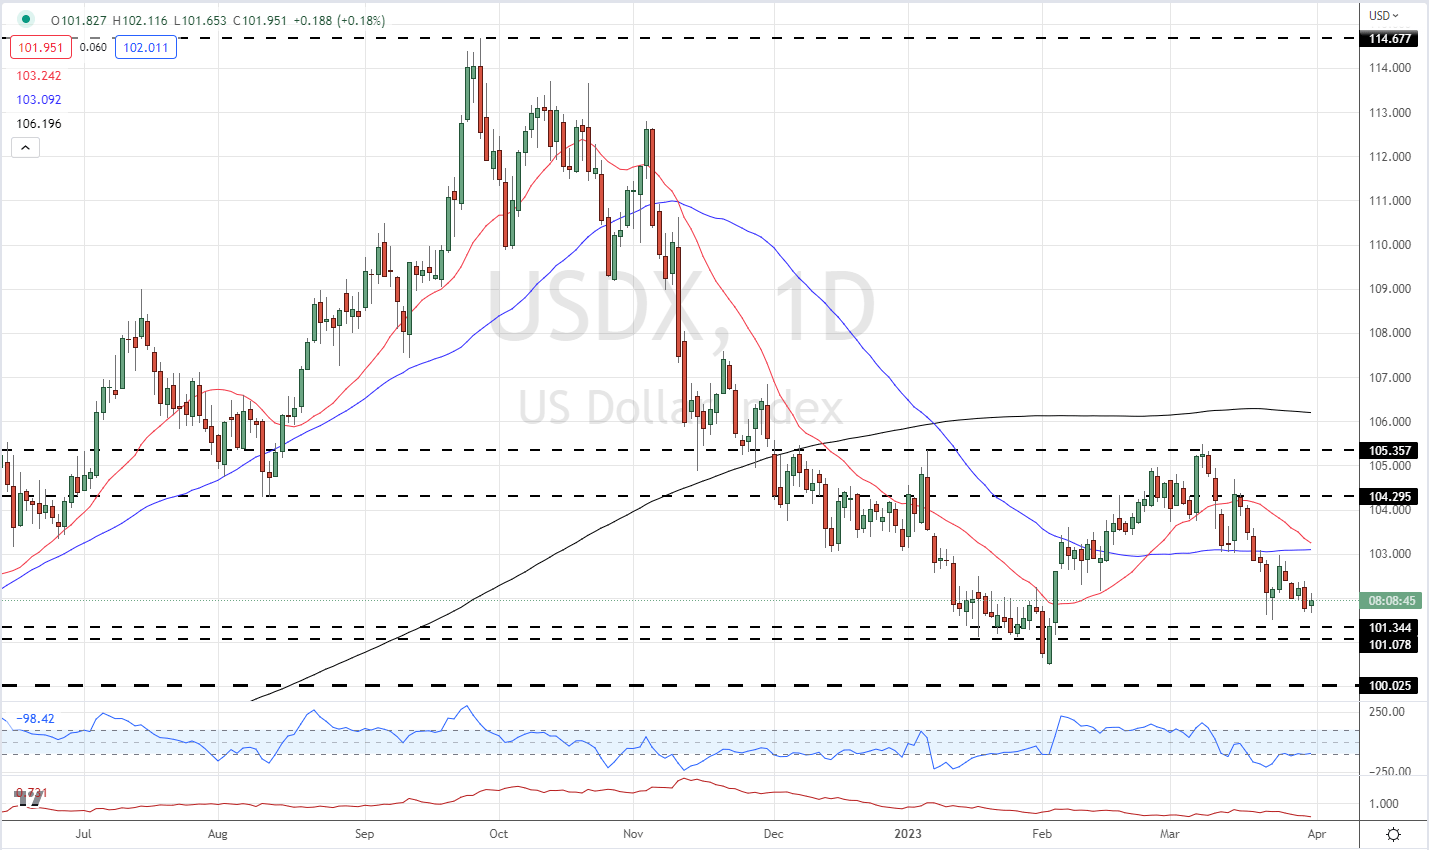
Charts via TradingView
What is your view on the US Dollar – bullish or bearish?? You can let us know via the form at the end of this piece or you can contact the author via Twitter @nickcawley1.


