


US Dollar, DXY Index, USD, SVB, Treasury Yields, Fed, Kashkari, Credit - Talking Points
- US Dollar languishes as Treasury yields struggle to hold their ground
- The banking situation might do some of the Fed’s work on financial tightening
- If Core PCE data later in the week is strong, what will it mean for DXY (USD) Index?
Trade Smarter - Sign up for the DailyFX Newsletter
Receive timely and compelling market commentary from the DailyFX team
The US Dollar softened again today after a selloff to end last week with the uncertainty surrounding the banking sector continuing to be assessed by markets.
It is being reported that First Citizen Bank closed a deal to acquire SVB Financial.
The announcement on the Federal Deposit Insurance Corporation (FDIC) website says, “The 17 former branches of Silicon Valley Bridge Bank, National Association, will open as First–Citizens Bank & Trust Company on Monday, March 27, 2023.”
The news may help to alleviate some worries, but the market will be eyeing Deutsche Bank’s share price today after taking a hammering on Friday on concerns that they too could be vulnerable to tightening financial conditions.
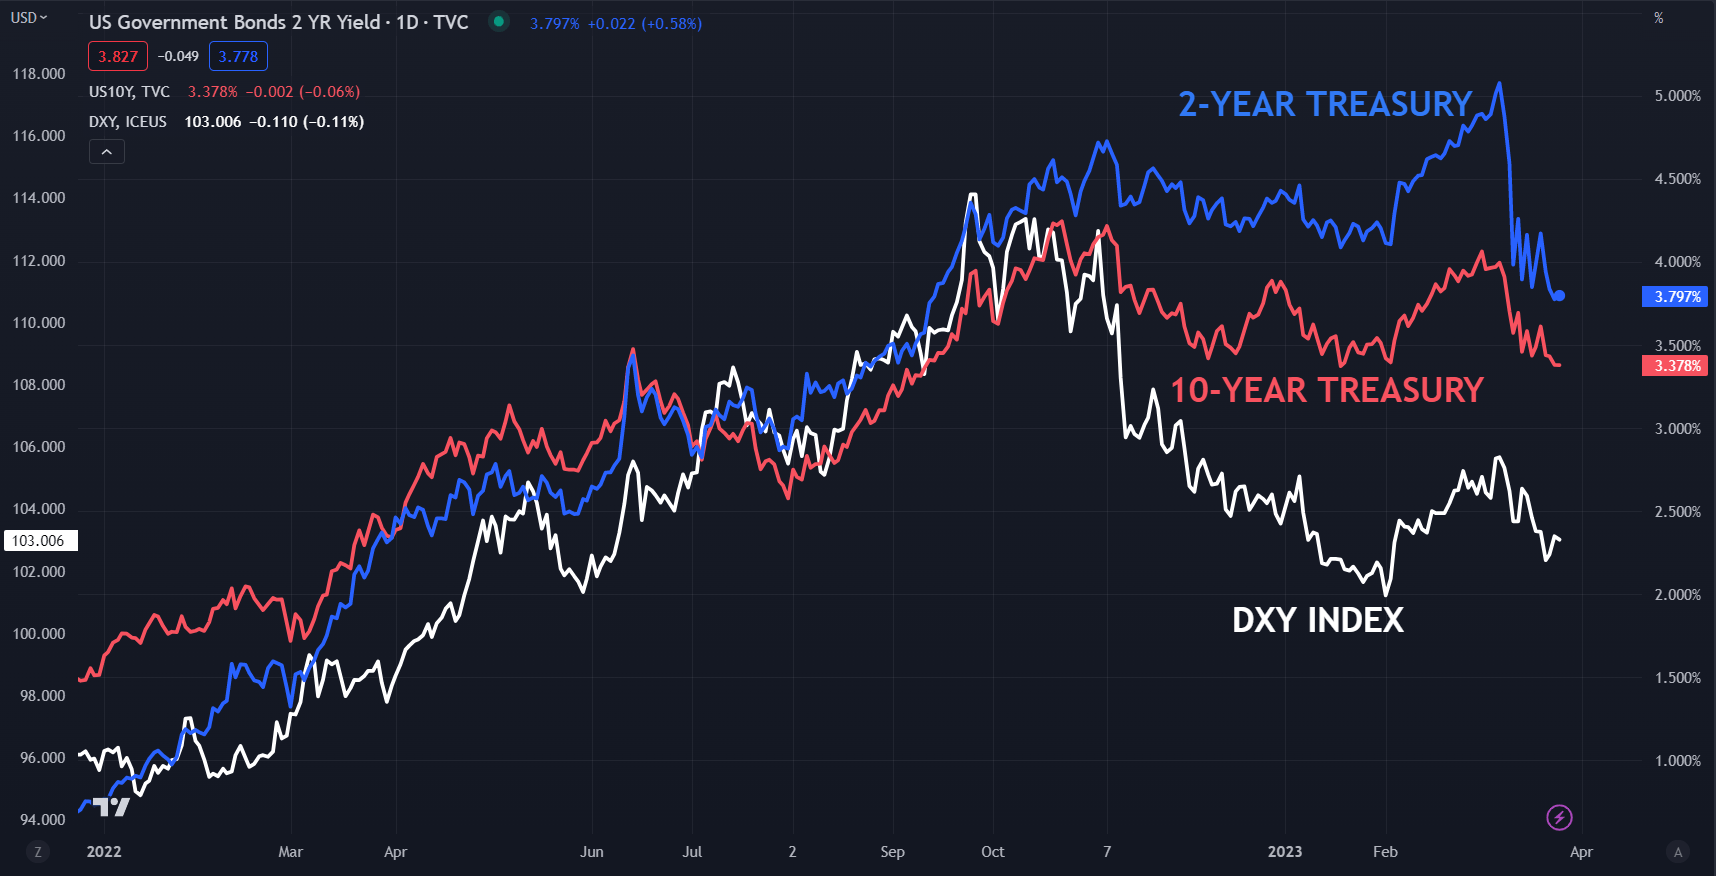
Treasury yields are little moved across most of the curve after a push lower on Friday. The benchmark 2-year note is trading near 3.80%, having yielded close to 5.10% a few weeks ago. It’s worth keeping in mind that it was under 2.40% at this time last year.
The 1-year bond managed to add some basis points today as markets vacillate about the trajectory of the Fed’s rate path.
The overall slide lower in Treasury yields appears to have undermined the DXY (USD) index.
DXY (USD) INDEX AGAINST 2- AND 10-YEAR TREASURY YIELDS
Over the weekend, Minneapolis Fed President Neel Kashkari said that a credit crunch might slow the economy and it is something that the Fed is watching closely.
After a whippy couple of weeks, crude oil has had a quiet start on Monday with the WTI futures contract a touch above US$ 69 bbl while the Brent contract is near US$ 75 bbl at the time of going to print.
Spot gold had an early look below USD 1,970 an ounce but moved back above there. The Aussie Dollar has been the best-performing major currency going into the European session.
Hong Kong’s Hang Seng Index (HSI) is a notable underperformer of APAC equity indices with earnings and the overall weakness in the housing sector weighing it down. Futures are pointing to a good to start the European and North American equity sessions.
The highlight of today’s economic calendar will be Germany’s IFO numbers. Later this week will see a slew of European CPI figures while the US will get GDP, Core PCE and jobs data.
The full economic calendar can be viewed here.

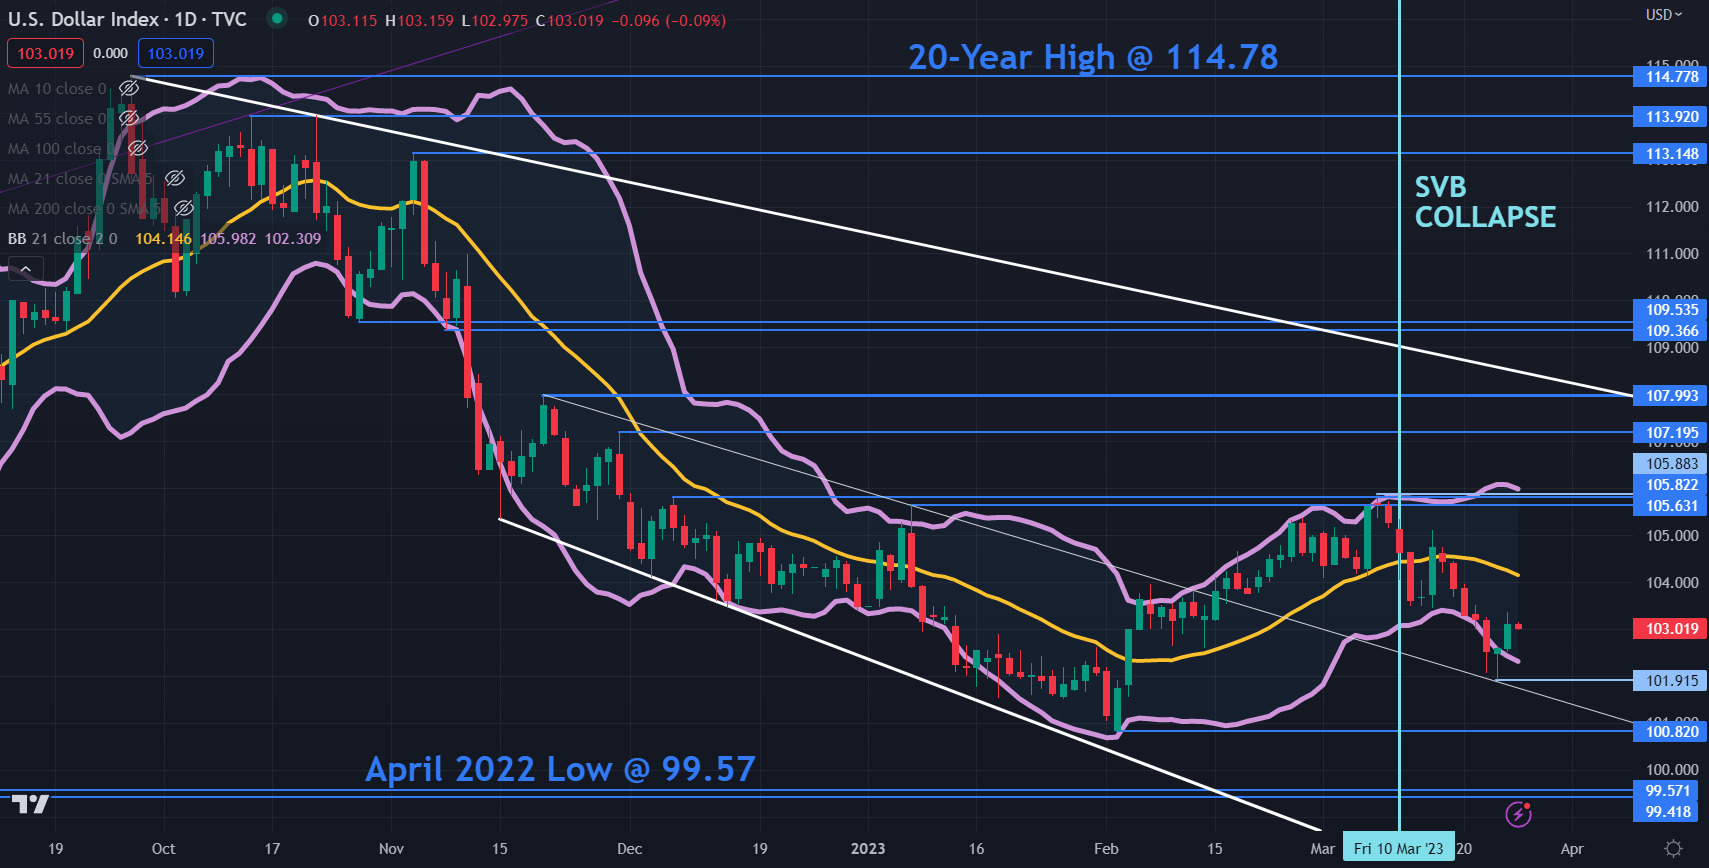
DXY (USD) INDEX TECHNICAL ANALYSIS
The DXY index remains in a broad long-term descending trend channel.
The recent sell-off broke below the lower band of the 21-day simple moving average (SMA) based Bollinger Band. Toward the end of last week, it closed back inside the band and that price action might signal a pause in the bearish run or a potential reversal.
Support might be at the recent lows of 101.93, 100.82, 99.57 and 99.42.
On the topside, the triple tops seen in the 105.63 – 105.88 area may provide a resistance zone. The previous peaks 107.70 and 1.08.00 could offer resistance ahead of the breakpoints at 109.37 and 109.54.
--- Written by Daniel McCarthy, Strategist for DailyFX.com
Please contact Daniel via @DanMcCathyFX on Twitter


