
US Dollar, EUR/USD, Gold - Prices and Analysis
The US dollar is trading at a multi-month high after data showed that inflation in the US is creeping higher. Despite higher US Treasury yields, gold continues to eye a fresh record high.
- US dollar strength is visible across a range of FX pairs.
- Gold prints a fresh high.
For all major central bank meeting dates, see the DailyFX Central Bank Calendar
Download our Brand New Q2 Euro Forecast Below

The US dollar is moving ever higher in early European turnover after data yesterday showed that inflation in the US may be nudging higher. Last Friday’s PCE data came in as expected, but Monday’s ISM data showed that price pressures in the US may increase. The latest S&P Global US Manufacturing PMI showed that US manufacturing expanding further but the Prices Paid index also showed output price inflation quickening for the fourth month running.
According to Chris Williamson, chief business economist at S&P Global Market Intelligence, ‘“The final reading of the S&P Global Manufacturing PMI signalled a further encouraging improvement in business conditions in March, adding to signs that the US economy looks to have expanded at a solid pace again in the first quarter…..“The upturn is, however, being accompanied by some strengthening of pricing power. Average selling prices charged by producers rose at the fastest rate for 11 months in March as factories passed higher costs on to customers, with the rate of inflation running well above the average recorded prior to the pandemic. Most notable was an especially steep rise in prices charged for consumer goods, which rose at a pace not seen for 16 months, underscoring the likely bumpy path in bringing inflation down to the Fed's 2% target.”
US S&P Global Manufacturing PMI
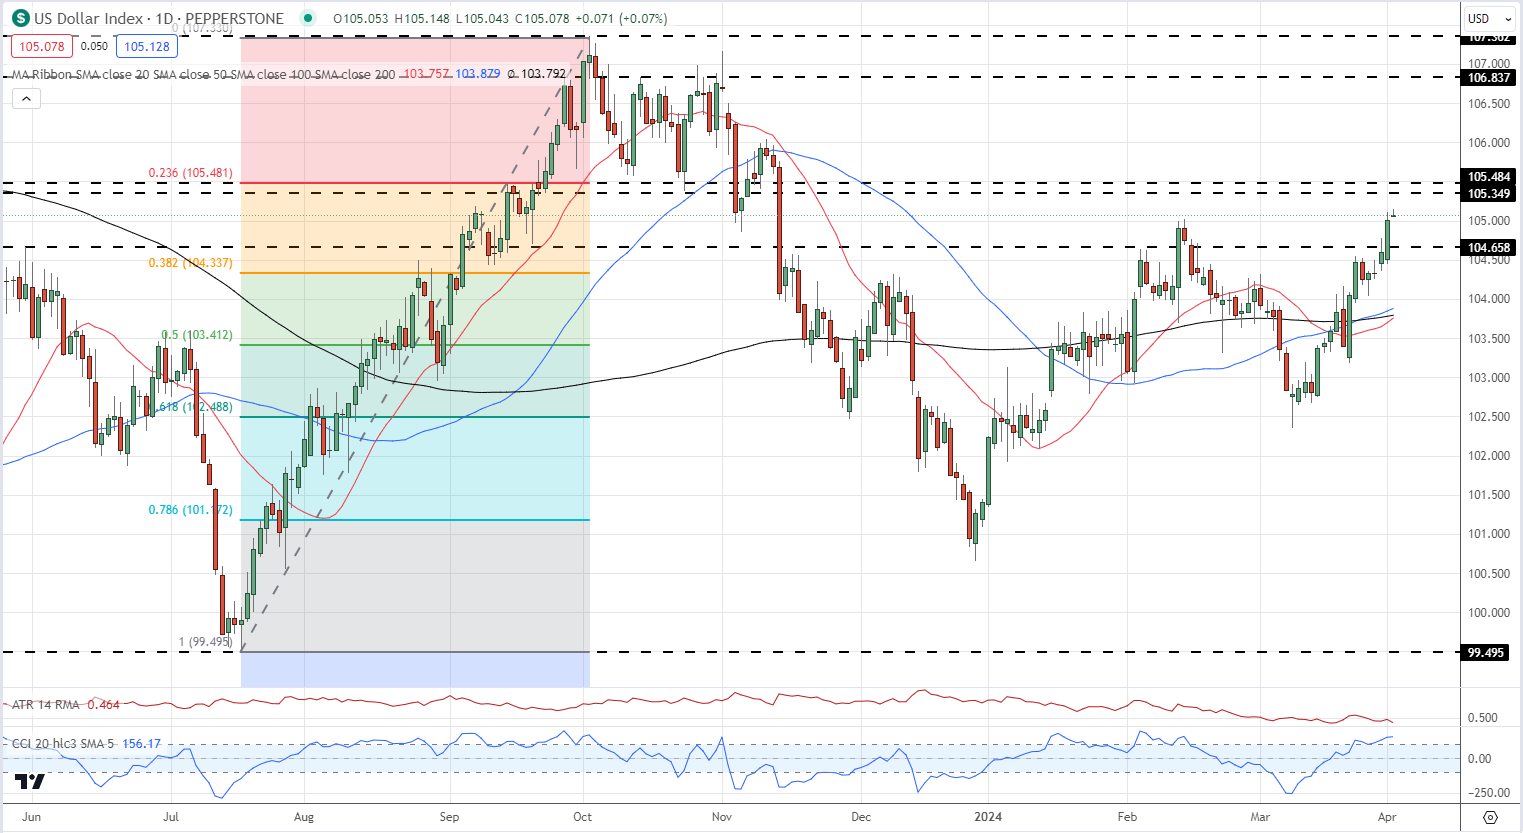
The US dollar index pushed higher after the data’s release, touching levels not seen since mid-November last year. The next resistance area is seen around the 105.45 area, which may need a fresh driver to be broken convincingly.
See our latest Q2 technical and fundamental analysis here

US Dollar Index Daily Price Chart
For all economic data releases and events see the DailyFX Economic Calendar
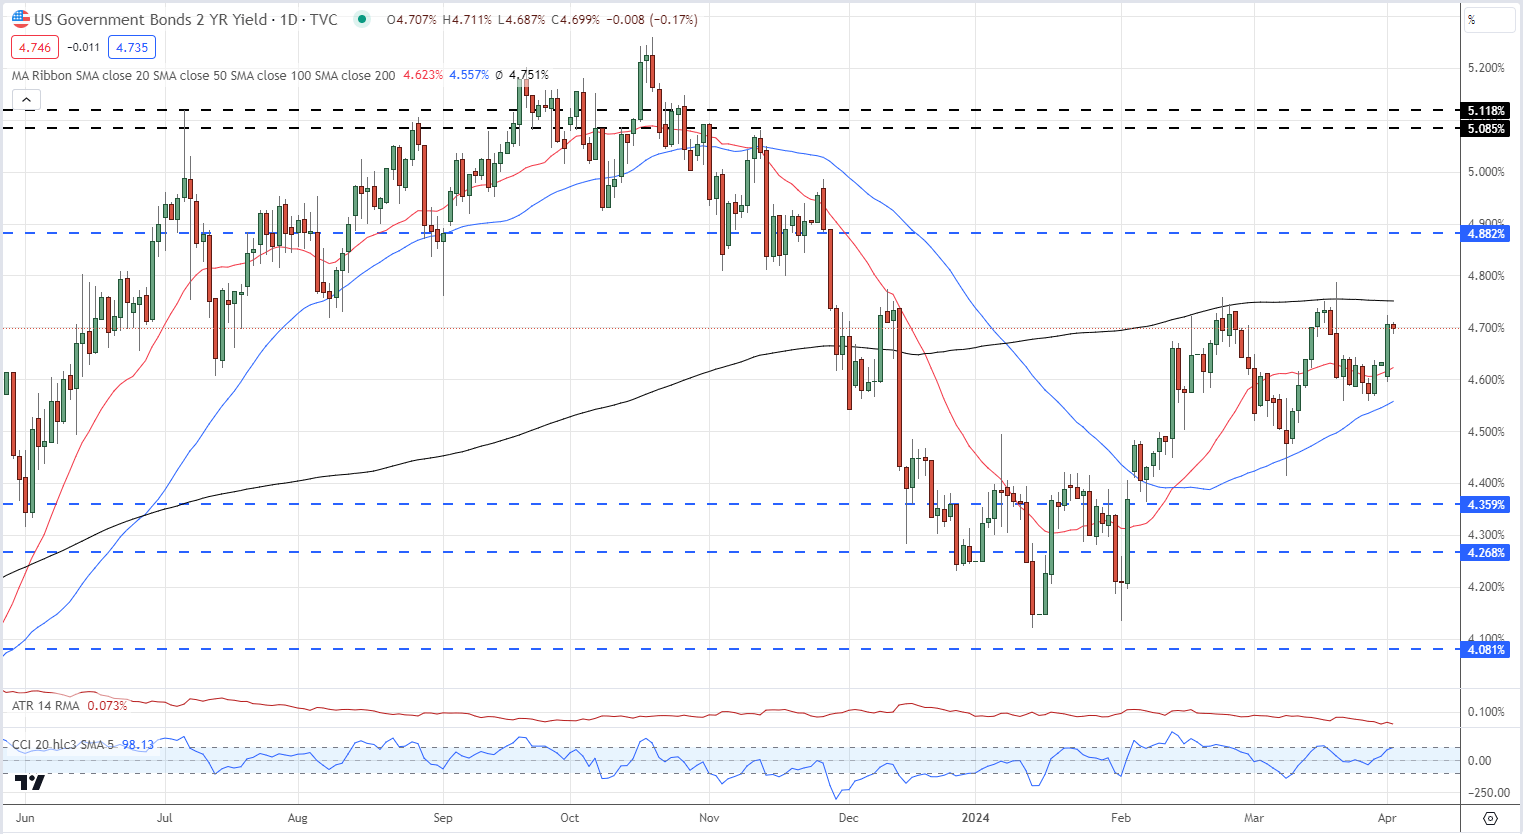
Short-dated US Treasury yields moved higher yesterday but need to break above the 200-day simple moving average – currently at 4.75% - if they are to test higher levels.
US 2-Yr Bond Yields
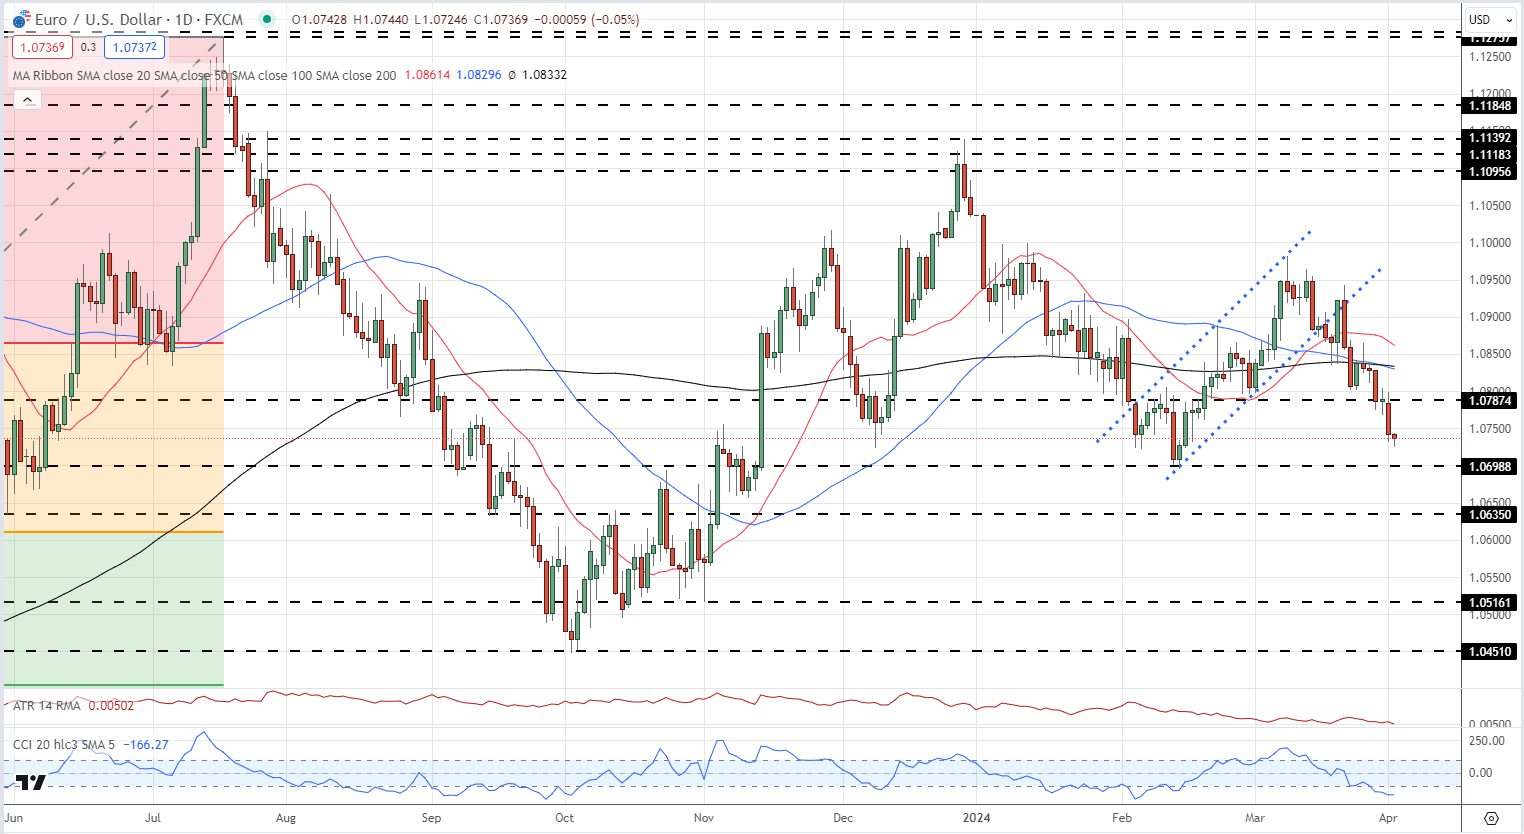
US dollar strength can be seen across various FX pairs, especially EUR/USD. While the USD is strong, the Euro remains weak with markets talking about potential back-to-back ECB rate cuts in June and July to boost tepid growth.
EUR/USD Daily Price Chart
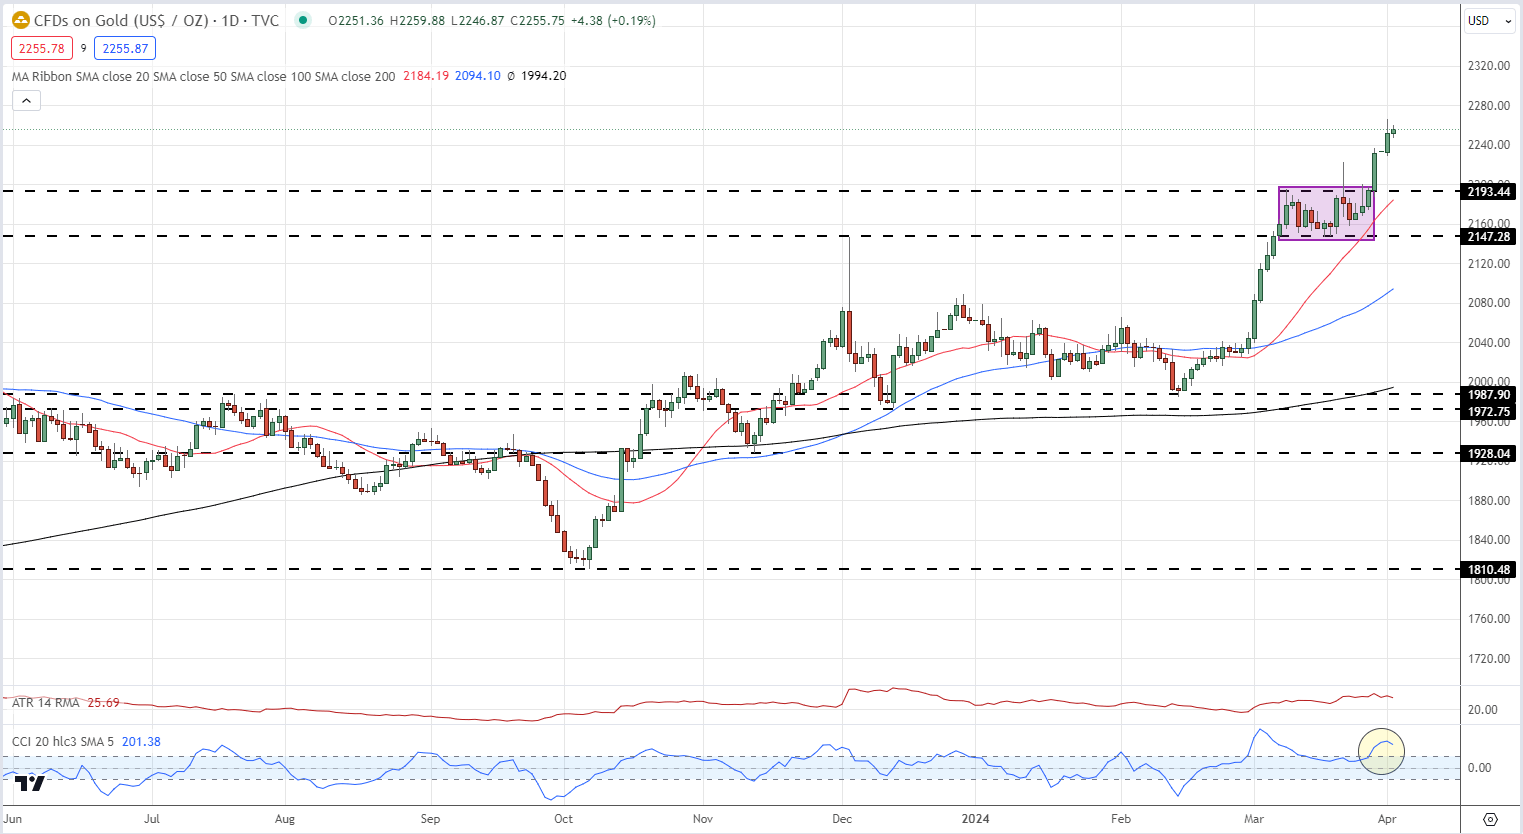
Gold has posted fresh record highs over the last few days, ignoring the stronger US dollar and the higher US rate backdrop. The precious metal made a bullish technical flag set up recently and broke higher mid-last week after probing upside resistance. The recent move is starting to look overbought, using the CCI indicator, and for the precious metal to continue higher a period of consolidation is needed.
Gold Daily Price Chart
All Charts via TradingView
Retail trader data shows 45.82% of traders are net-long Gold with the ratio of traders short to long at 1.18 to 1.The number of traders net-long is 6.86% higher than yesterday and 4.66% lower than last week, while the number of traders net-short is 2.76% lower than yesterday and 9.38% higher from last week.
We typically take a contrarian view to crowd sentiment, and the fact traders are net-short suggests Gold prices may continue to rise.
| Change in | Longs | Shorts | OI |
| Daily | 0% | 5% | 2% |
| Weekly | -7% | 3% | -3% |
What are your views on the US Dollar – bullish or bearish?? You can let us know via the form at the end of this piece or you can contact the author via Twitter @nickcawley1.