


US Dollar (DXY) Price, Chart, and Analysis
- Is the Fed looking at ‘one more and done’?
- Wednesday’s US inflation release remains key for the greenback’s short-term direction.

The US dollar index is trading at a fresh two-month low after comments from Fed officials on Monday suggested that they are discussing holding fire on future interest rate hikes if data permits. With a 25 basis point increase already fully priced in this month, it may be that the US central bank is looking to put further increases on hold, bringing to an end the monetary policy tightening seen over the last 15 months.
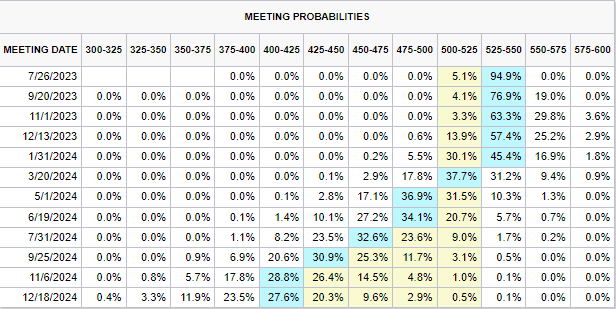
The latest CME Fed Fund probabilities are in line with Fed thinking with rates seen peaking this month before a period of calm heading into next year.
CME Fed Fund Probabilities
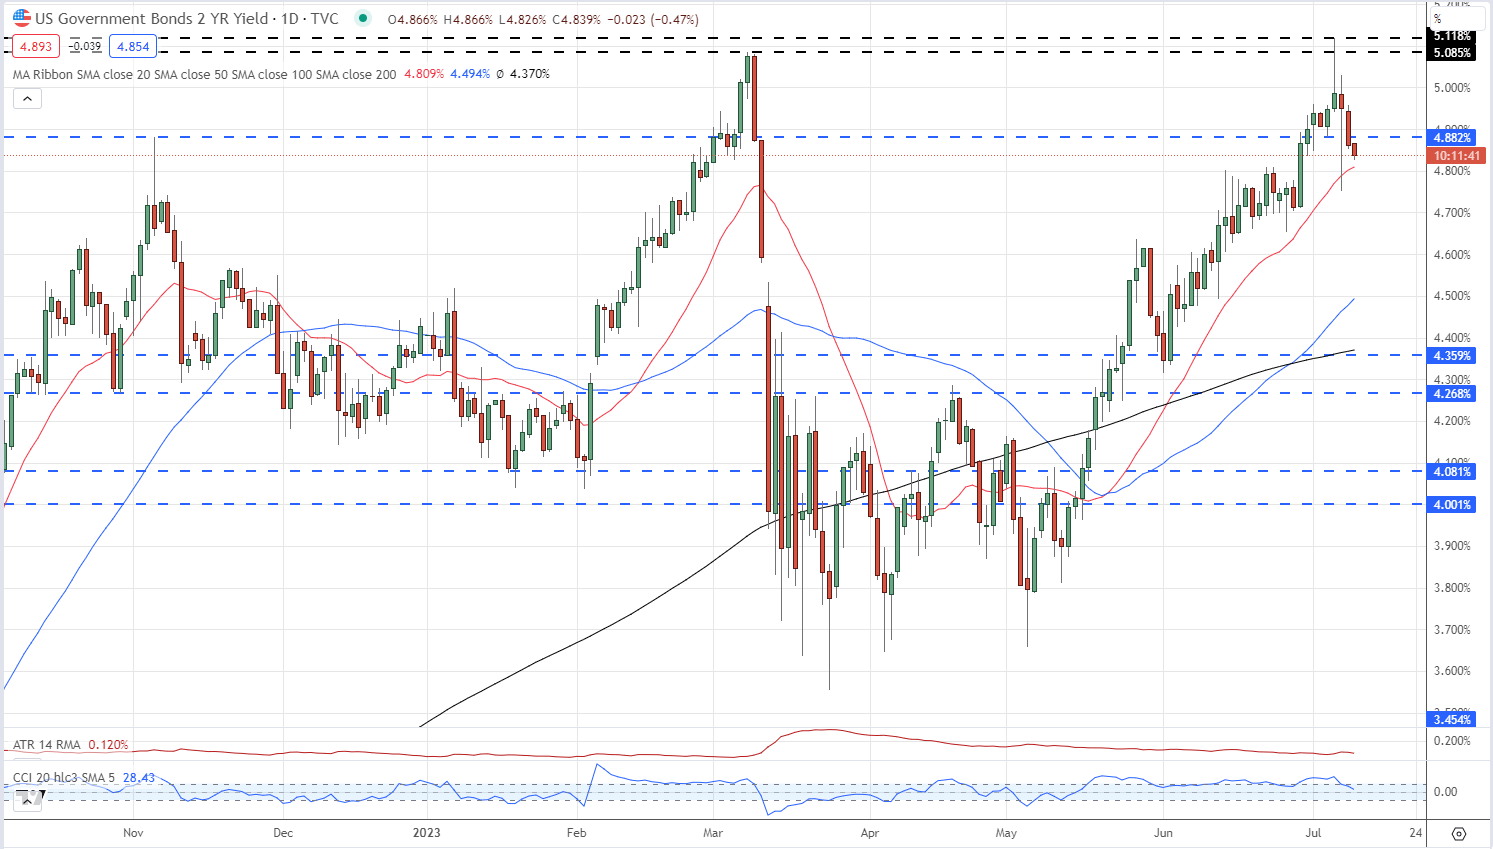
US Treasury yields slipped lower yesterday with the recent double high around 5.08% to 5.11% now seen as a potential cycle high for the interest-rate sensitive UST 2 year.
US Treasury Two Year Yields Daily Chart
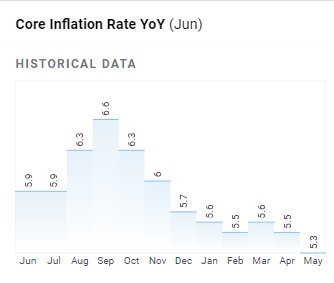
The latest US inflation report is released on Wednesday with the market forecasting a sharp drop in annual headline inflation to 3.1% from 4.0% last month (May). Headline inflation was running at 9.1% in June last year. Core inflation is proving slightly stickier, and causing the Fed more concerns, and is seen falling to 5.0% from a prior month’s reading of 5.3%.
For all market-moving data releases and economic events see the real-time DailyFX calendar

The daily US dollar chart shows the greenback falling sharply since last Friday, breaking through both the 20- and 50-day simple moving averages. The dollar is now heading toward a support zone made up of a cluster of prior lows made between early April and mid-May this year. This support zone is likely to hold any further falls in the greenback, in the short-term at least, before the psychological 100 level comes into play. With short-term US bond yields expected to remain at, or just below, current levels, the US dollar will come under pressure further pressure from other currencies' ongoing rate hiking cycles, namely the Euro and the British Pound. The future path for the US dollar index is therefore likely to be decided by external factors in the months ahead.
US Dollar (DXY) Daily Price Chart – July 11, 2023
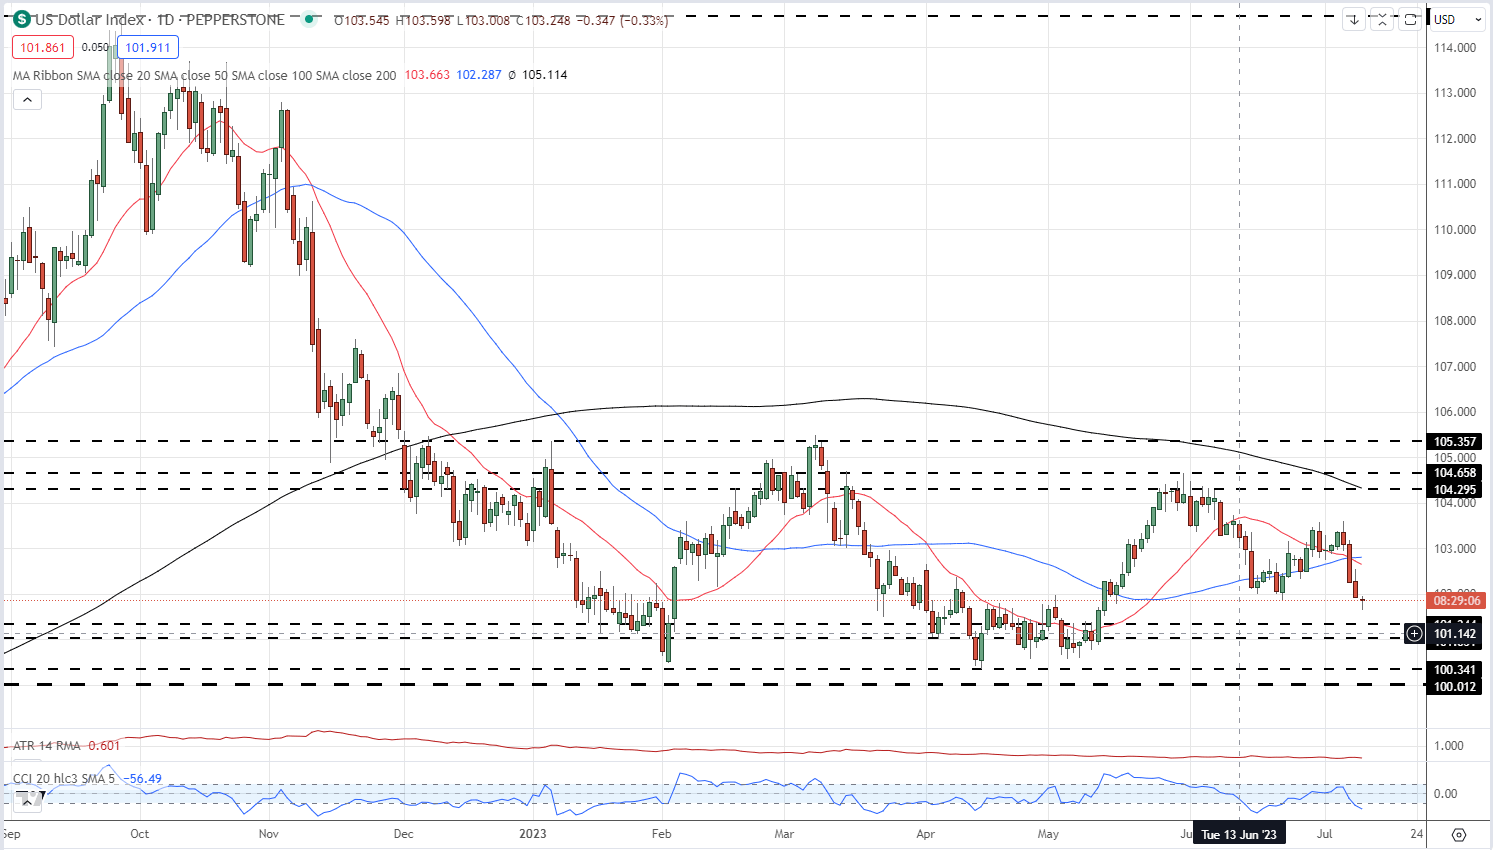
Chart via TradingView
What is your view on the US Dollar – bullish or bearish?? You can let us know via the form at the end of this piece or you can contact the author via Twitter @nickcawley1.


