


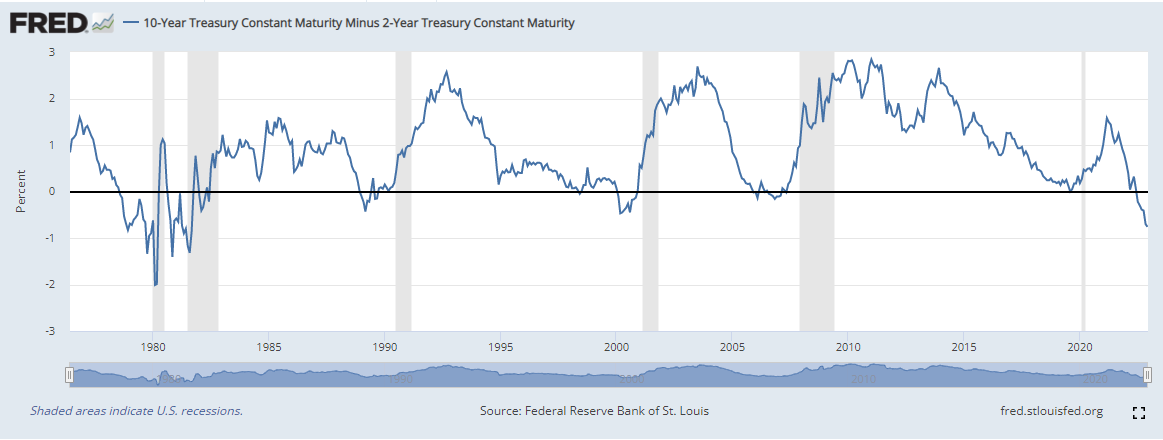
The closely followed US 2s-10s yield curve has been heavily inverted (2yr UST yields more than 10yr UST) for the best part of six months now as bond markets price in a heavy recession in the US. This rate differential is now back at levels last seen during the 1980s economic recession when the then Federal Reserve chairman Paul Volcker tightened monetary policy uber-aggressively to curb sky-high inflation. These rate increases sent the economy spiraling into a deep recession and while some would argue that his aggressive actions cost tens of millions of Americans their jobs, others would argue that chair Volcker set the backdrop for strong economic expansion over the next two decades.
The FOMC has increased interest rates aggressively over the year to combat inflation and is now easing back slightly in an effort to make the upcoming recession as shallow, and hopefully short-lived, as possible while sticking to the central bank’s mandate on price pressures. Financial markets are already looking at the Federal Reserve starting to lower rates in Q4 2023 and as these expectations build, the interest rate differential between the rate-sensitive US 2-year and the benchmark US 10-year will begin to narrow and eventually re-invert. A look at the 2s-10s curve below shows that the last three times the curve inverted, it reversed that set-up reasonably quickly. To take advantage of the curve turning positive again, a weighted long US 2-year vs. a short US 10-year position would be beneficial. As always, when bond prices go up their yields go down, and vice versa.
From a technical perspective, the US 2-year yield chart shows a topping out ‘head and shoulders’ pattern which suggests that yields are heading lower with the 4.00%-4.08% the next likely landing zone.
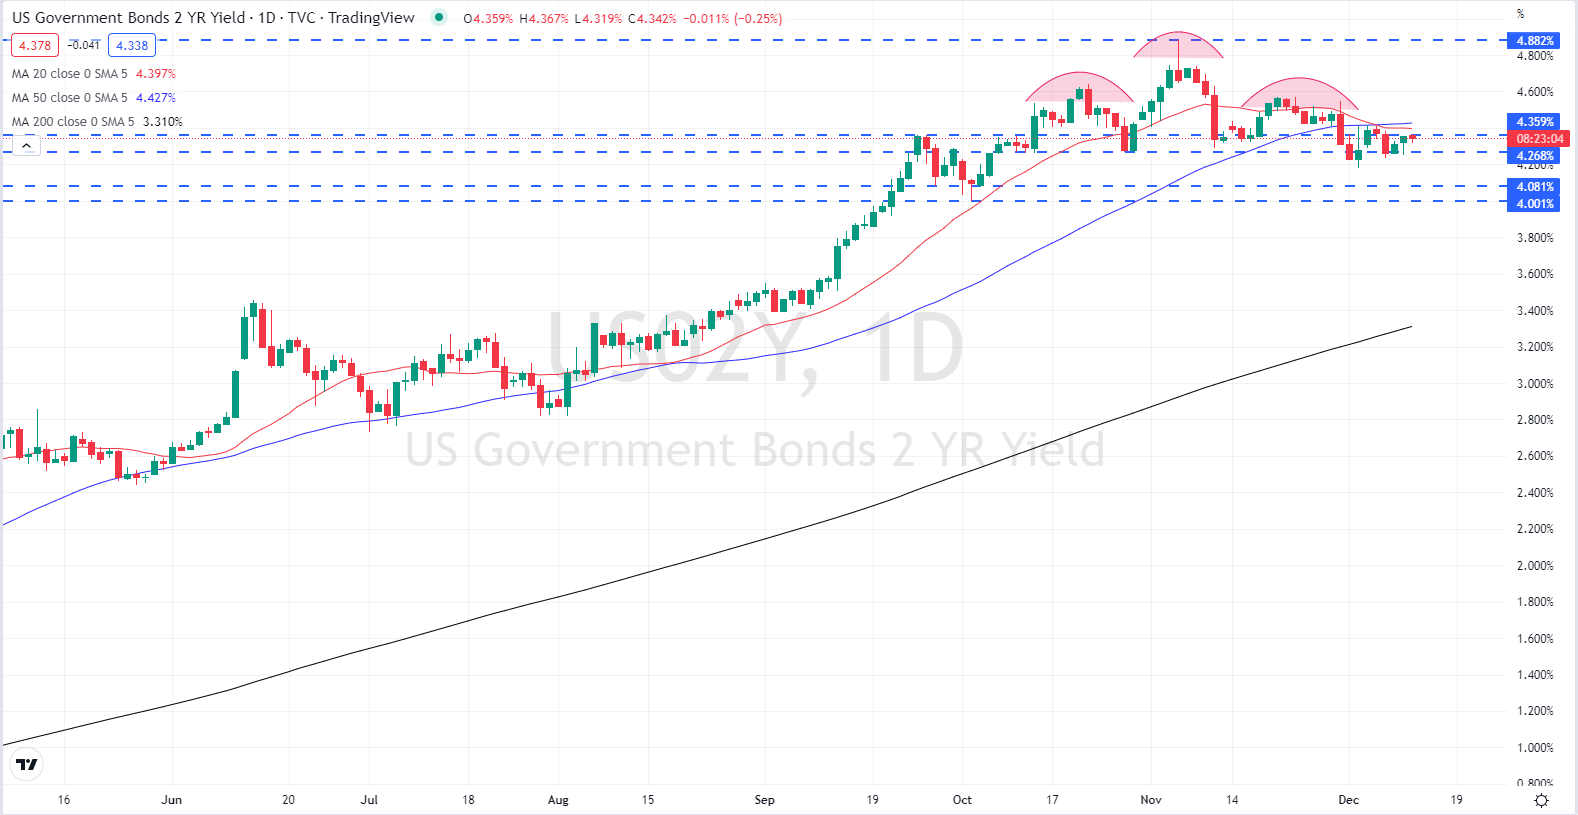
Chart by TradingView


