Article by IG Senior Market Analyst Axel Rudolph
FTSE 100, DAX 40, S&P 500 Analysis and Charts
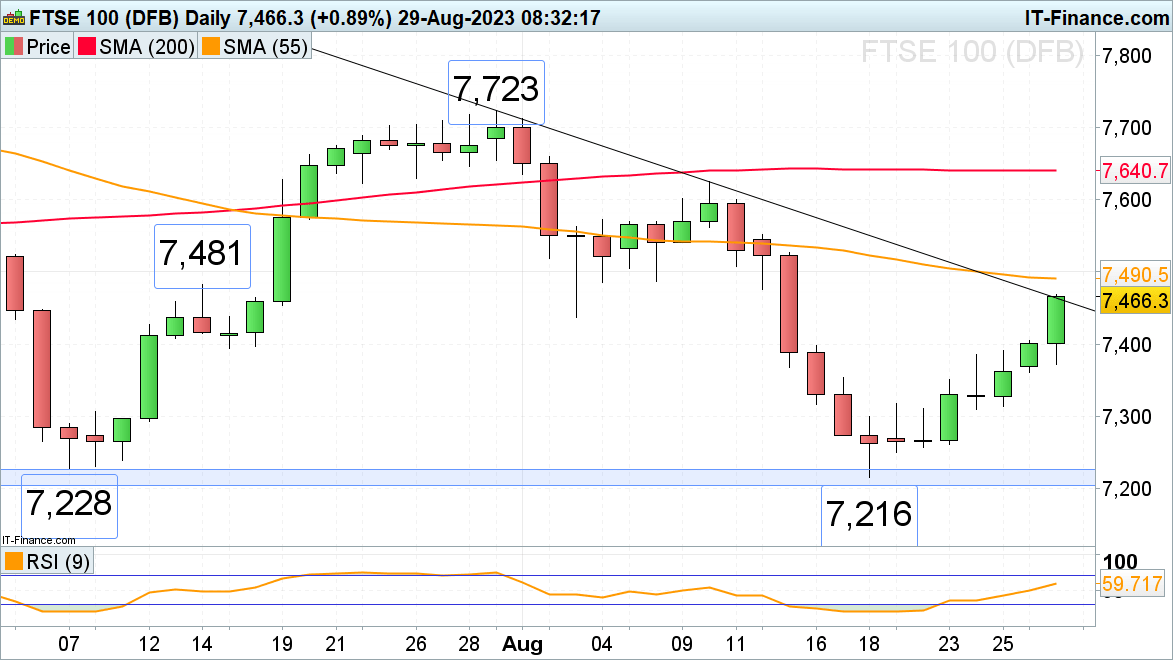
FTSE 100 probes downtrend line
The FTSE 100 is trying to break through its July-to-August downtrend line following a prolonged Bank Holiday weekend in the UK during which Chinese authorities cut share dealing stamp duty by 50%. The 55-day simple moving average (SMA) at 7,490 represents the next upside target ahead of the minor psychological 7,500 mark.
The May, June and early August lows at 7,437 to 7,401 should now offer good support.
FTSE 100 Daily Chart
See the Latest IG Sentiment for the FTSE 100
| Change in | Longs | Shorts | OI |
| Daily | 12% | 0% | 1% |
| Weekly | -7% | 9% | 6% |
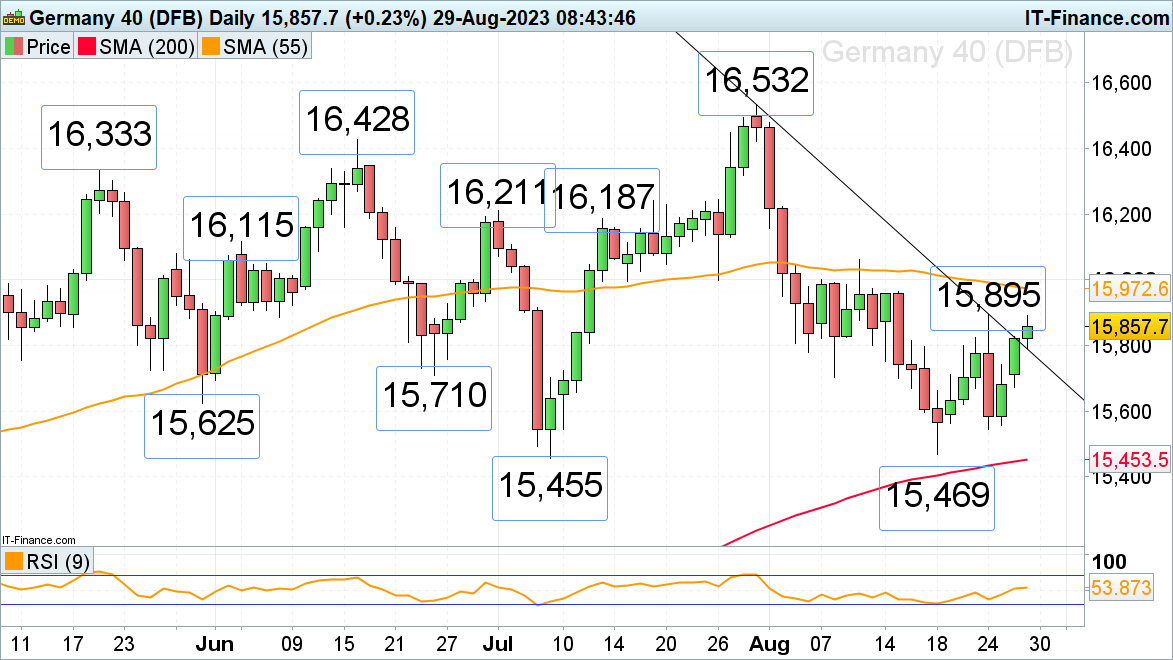
DAX 40 probes last week’s high
The DAX 40 is revisiting last week’s high at 15,895 on a globally slightly more positive outlook regarding rates following last week’s Jackson Hole symposium and weaker economic data. If 15,895 were to be exceeded despite German consumer morale unexpectedly falling, the 55-day simple moving average (SMA) at 15,973 would be eyed ahead of the 10 August high at 16,062. This high would need to be exceeded, for a medium-term bullish reversal to be confirmed.
Potential slips should find support along the breached one-month resistance line, now because of inverse polarity a support line, at 15,792.
DAX 40 Daily Chart

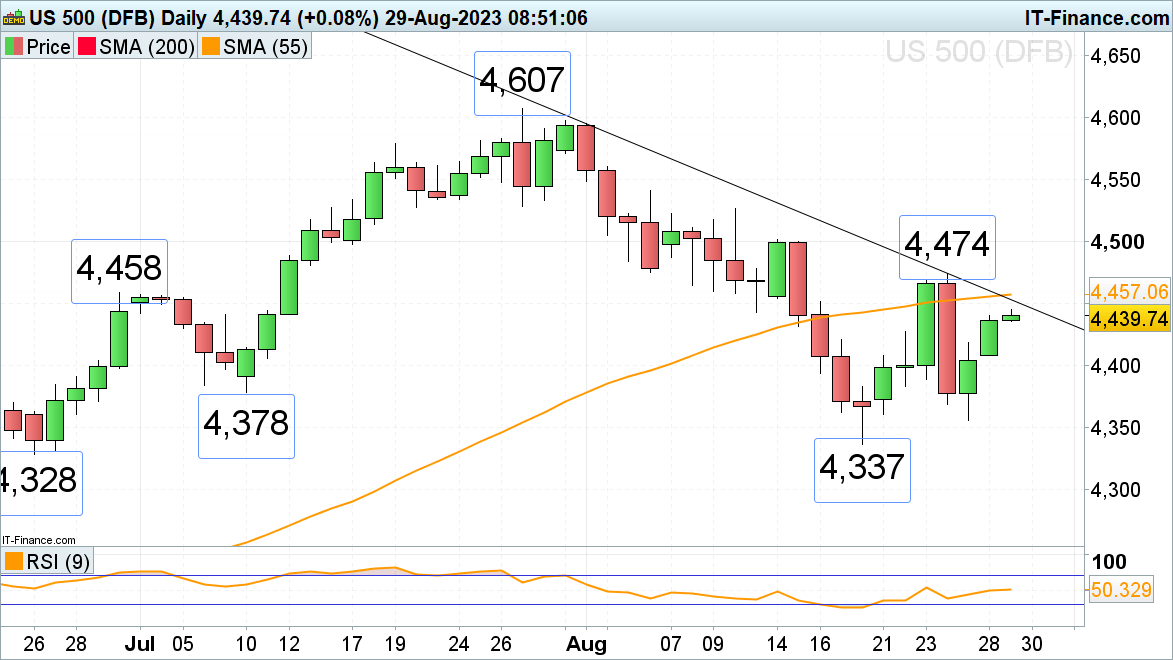
S&P 500 approaches its July-to-August downtrend line
The S&P 500 is still in the process of regaining last Thursday’s sharp losses and nears resistance which sits between the July-to-August downtrend line and the 55-day simple moving average (SMA) at 4,453 to 4,457. It does so as investors look ahead to today’s U.S. consumer confidence and job openings data. The next higher high at 4,474, seen last week, would need to be exceeded for a bullish reversal to gain traction and put the July peak at 4,607 back on the map.
Minor support can be found at the 4,378 July low. Further down lies major support between the June and mid-August lows at 4,337 to 4,328.
S&P 500 Daily Chart