Article by IG Senior Market Analyst Axel Rudolph
FTSE 100, DAX 40 and Nasdaq 100 Analysis and Charts
Introduction to Technical Analysis
Trade the News
Recommended by IG
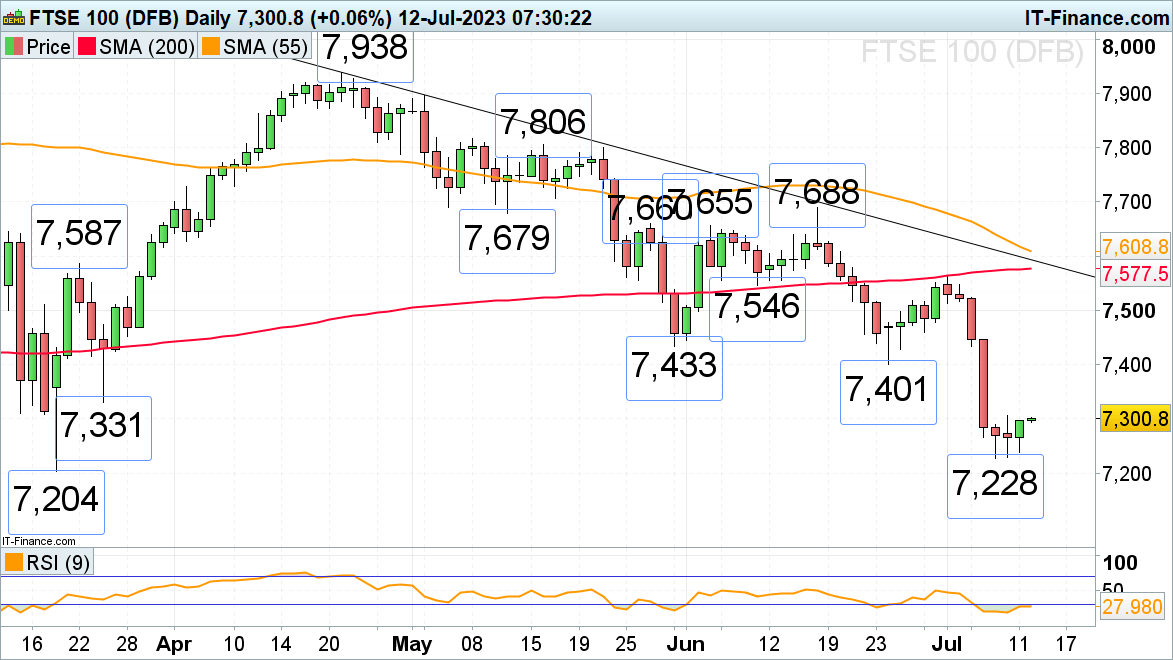
FTSE 100 stabilizes ahead of U.S. inflation data
The FTSE 100 managed to stabilize above its March low at 7,204 ahead of today’s key U.S. consumer price inflation (CPI) which is expected to come in at 3.1% in June, following May's 4% year-on-year increase. A rise above Monday’s high at 7,306 would put the 7,331 late March low on the map. Far more significant resistance can be seen between the May and early June lows at 7,401 to 7,433. While this area caps, overall downside pressure should retain the upper hand.
A fall through last week's low at 7,228 would push the 7,204 March low to the fore, below which the October 2022 high and the November 2022 low at 7,104 to 7,071 can be seen.
FTSE 100 Daily Price Chart
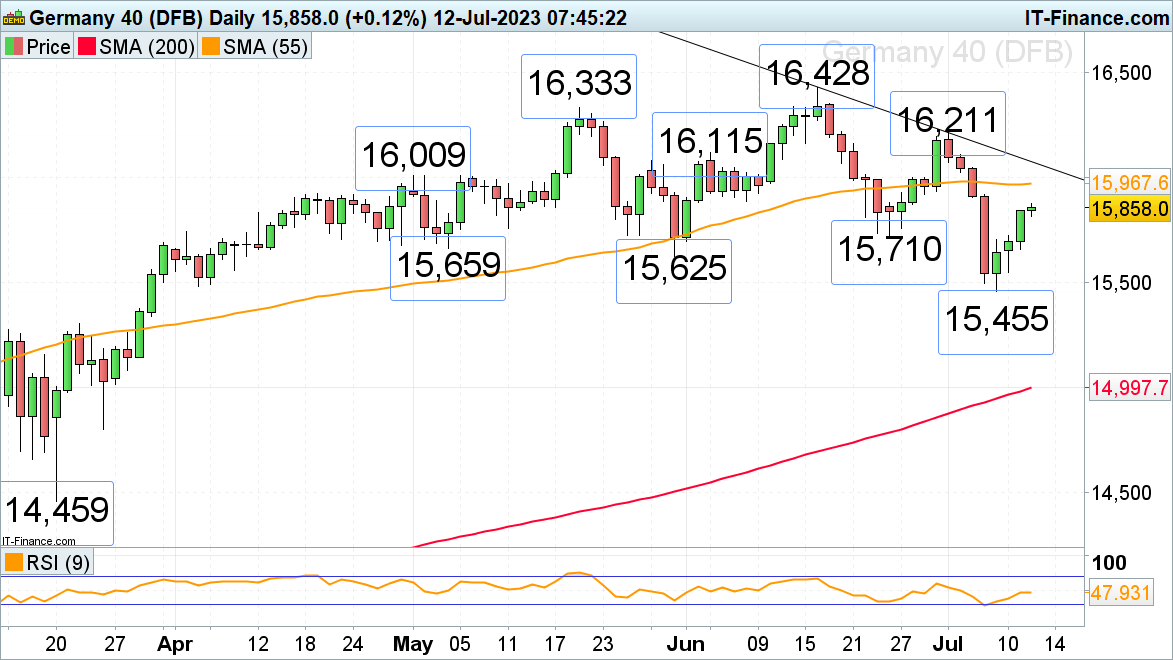
DAX 40 has seen three days of consecutive gains
Last week’s sell-off to its 3 ½ months low at 15,455 has been followed by three consecutive days of gains for the DAX 40 which is approaching the 15,886 to 15,967 resistance zone ahead of today’s U.S. inflation print. It is where the early June lows and the 55-day simple moving average (SMA) can be seen. Further up a one-month resistance line can be spotted at 16,074.
The April-to-July lows at 15,710 to 15,625 should offer support today in case of U.S. inflation remaining stubbornly high or core inflation coming in above its expected 5.0% year-on-year level for June.
DAX 40 Daily Price Chart

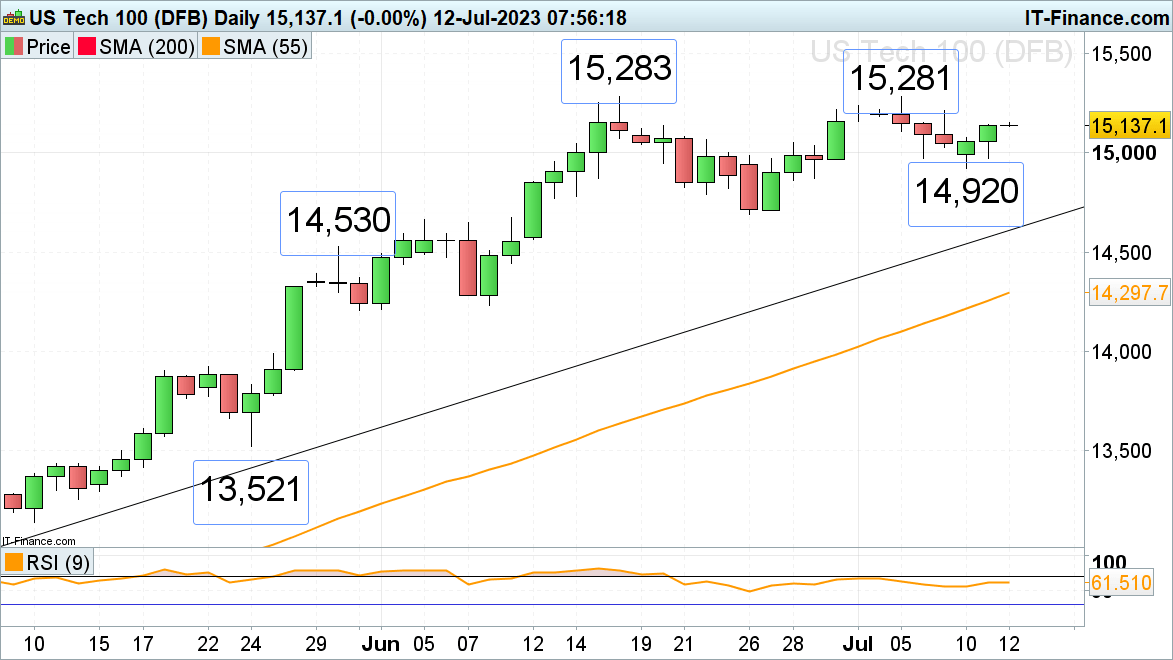
Nasdaq 100 mixed ahead of U.S. CPI release
The Nasdaq 100’s recent decline has been very shallow when compared to other U.S. but especially European stock indices with it slipping to Monday’s low at 14,920. Since then it has risen over two consecutive days ahead of today’s U.S. inflation data and earning season kicking off later this week. Immediate resistance can be seen at Friday’s 15,211 high, above which key resistance sits at the 15,281 to 15,283 June and early July highs. If overcome, the December 2021 low at 15,502 would be targeted.
Support below the psychological 15,000 mark lies at the 6 and 11 July lows at 14,971 ahead of Monday’s 14,920 trough. If this level were to give way, the late June low at 14,689 would be back in the picture.
Nasdaq 100 Daily Price Chart