Article by IG Senior Market Analyst Axel Rudolph
FTSE 100, CAC 40, Nasdaq 100 Analysis and Charts
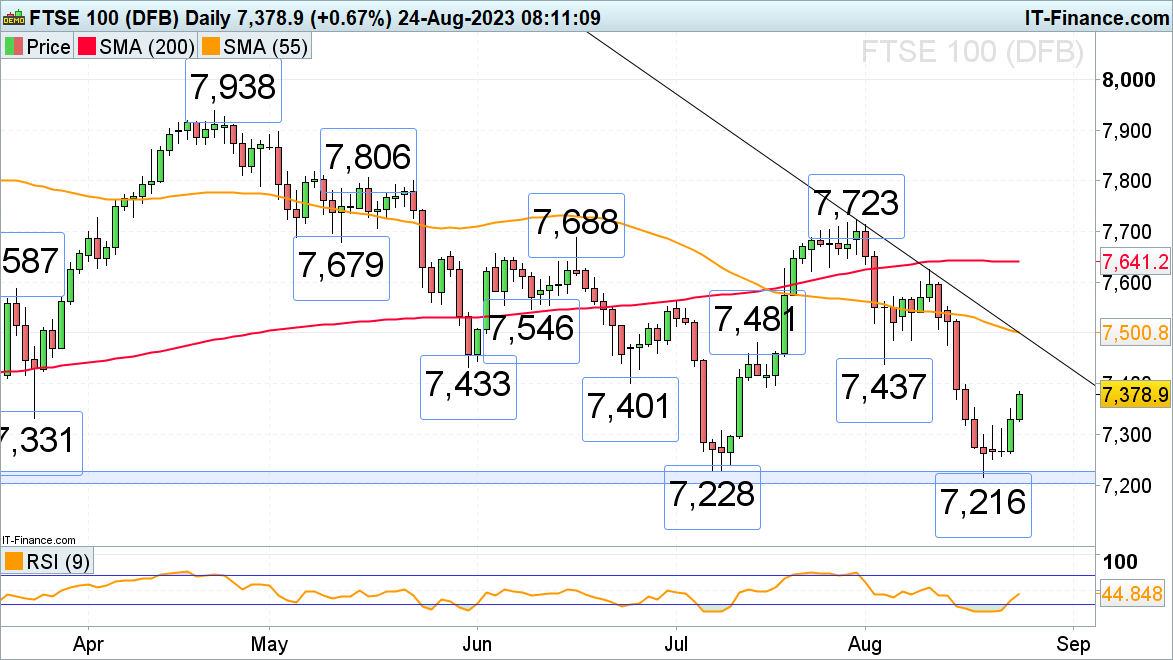
FTSE 100 benefits from risk-on appetite
The FTSE 100 is on track for a second day of gains as it follows Asian stock indices higher ahead of today’s start of the Jackson Hole symposium.The UK blue chip index is now gunning for the May, June, and early August lows at 7,401 to 7,437 which may cap it today, though. If not, the mid-July high at 7,481 could be reached as well ahead of the 55-day simple moving average (SMA) at 7,501.
Slips should find support around Monday’s high at 7,317.
FTSE 100 Daily Chart

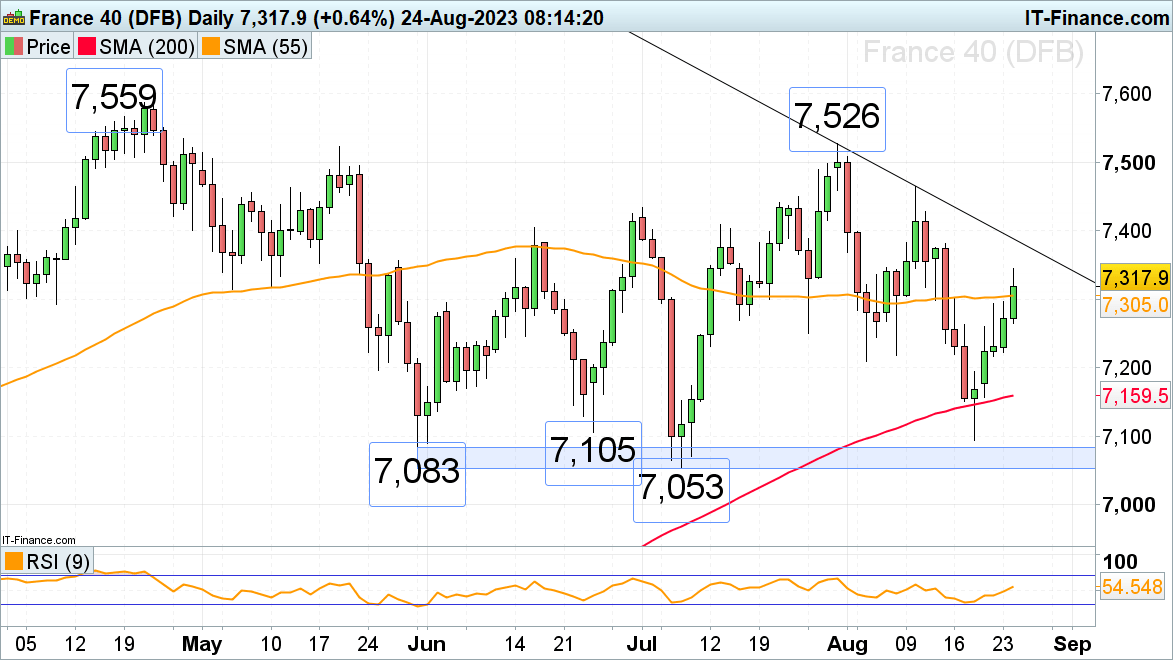
CAC 40 on track for fifth consecutive day of gains
The French CAC 40 index’s advance on general stock market optimism is on track for its fifth consecutive day of gains, fuelled by stellar Nvidia overnight results. With the 55-day simple moving average (SMA) at 7,305 having been exceeded, the July-to-August downtrend line at 7,389 and the mid-June peak at 7,405 are next in line.
Support below the 55-day SMA can be spotted at the late July low at 7,251.
CAC 40 Daily Chart

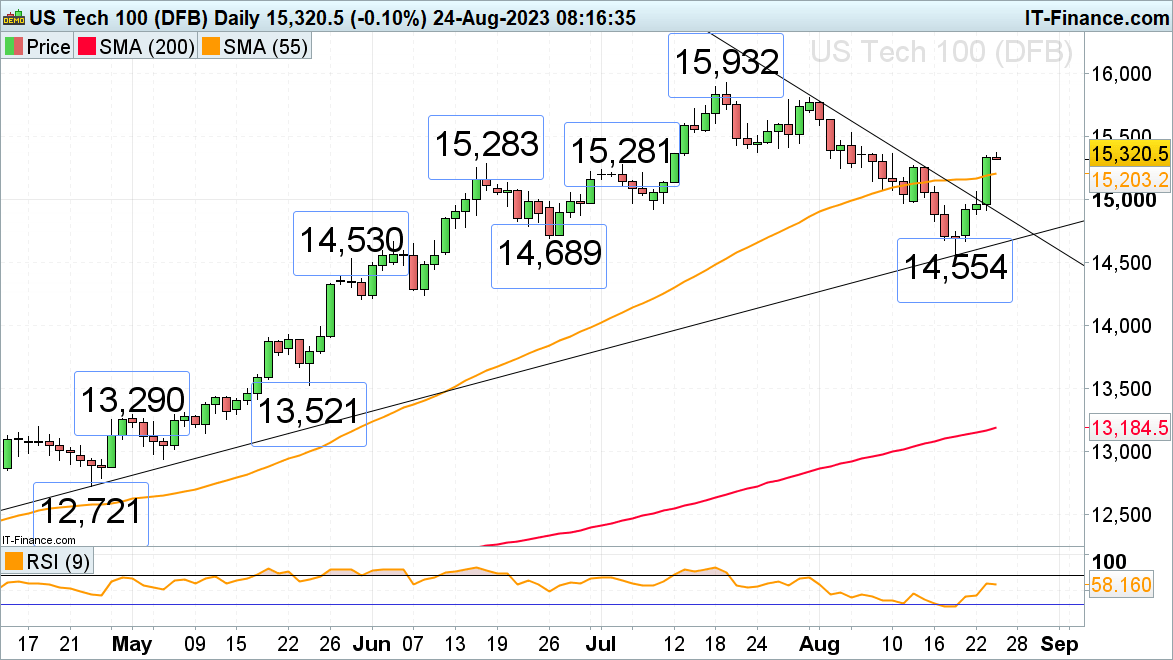
Nasdaq 100 surges higher on AI-driven exceptional Nvidia results
The Nasdaq 100’s summer correction has most likely run its course with the index having risen above its 55-day simple moving average (SMA) at 15,203 in after-hours trading following Nvidia’s stellar results and $25 billion buy back. The late July low at 15,372 is within reach but may offer short-term resistance. If overcome on a weekly chart closing basis, the July peak at 15,932 will be back in focus.
Minor support below the 55-day SMA sits between Tuesday’s high at 15,066 and the minor psychological 15,000 mark.
Nasdaq 100 Daily Chart