Article by IG Senior Market Analyst Axel Rudolph
FTSE 100, CAC 40, Nasdaq 100 Analysis and Charts
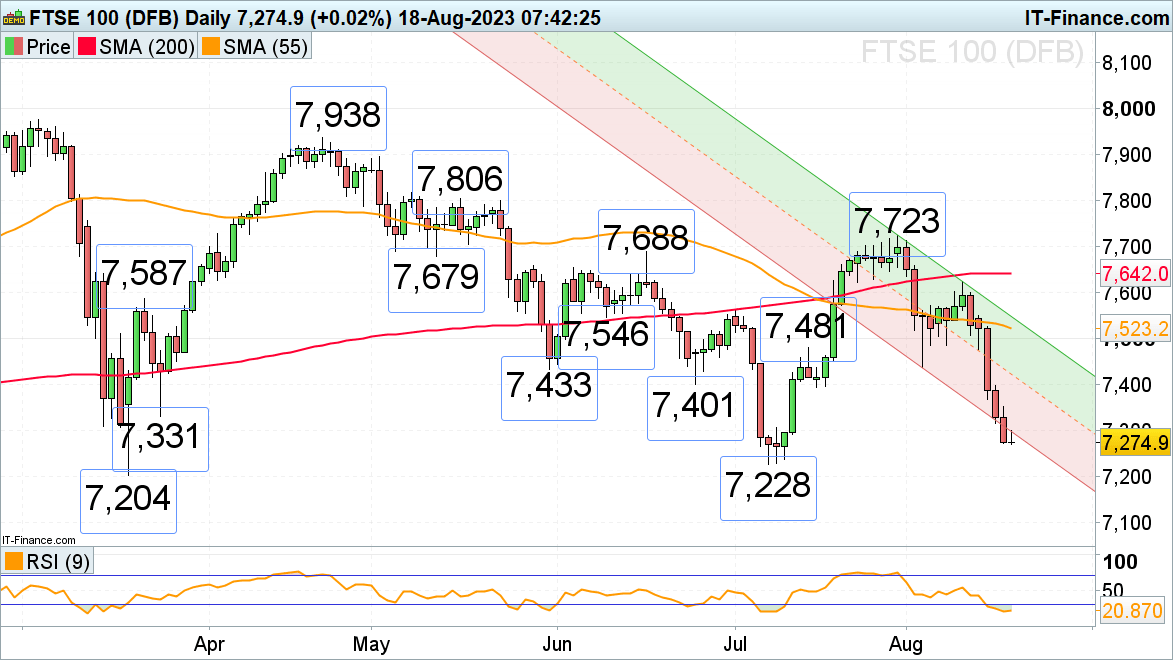
FTSE 100 drops further as UK retail sales fall by more than expected
The rout in the FTSE 100 is ongoing as UK retail sales dropped by 1.2% month-on-month in July, worse than an expected 0.5% drop and after a downwardly revised 0.6% rise in June. The UK blue-chip index is fast approaching its 7,228 July trough. Between it and the 7,204 March low the index is expected to at least find interim support.
Minor resistance can be found at the 24 March low at 7,331 and more significant resistance between the May and June lows at 7,401 to 7,433.
FTSE 100 Daily Chart
Learn How IG Client Sentiment Can Affect Price Action
| Change in | Longs | Shorts | OI |
| Daily | -14% | 4% | 1% |
| Weekly | 15% | 2% | 4% |
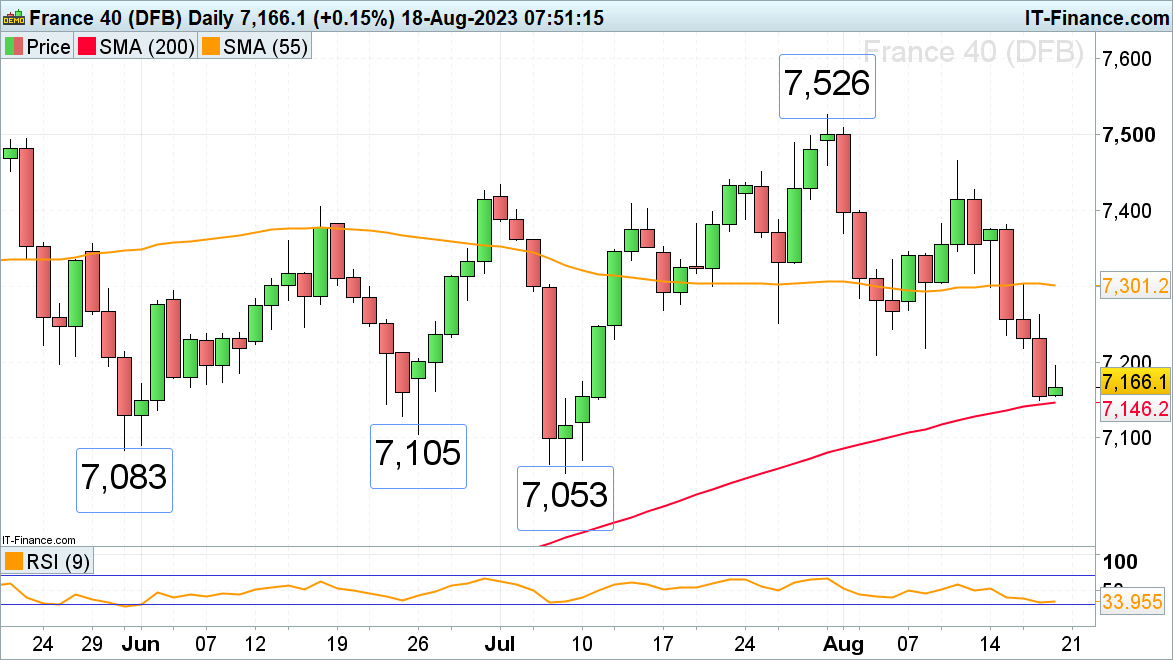
CAC 40 slide approaches major support
The slide in the French CAC 40 index has practically reached the 200-day simple moving average (SMA) at 7,146 on global risk-off sentiment triggered by China growth concerns, US yields rising to 2008 levels and after China's Evergrande filed for bankruptcy protection in New York. Below the 200-day SMA the June low at 7,105 might offer minor support ahead of the more significant May and July lows at 7,083 to 7,053.
Resistance can be seen between the early August lows at 7,210 to 7,218.
CAC 40 Daily Chart

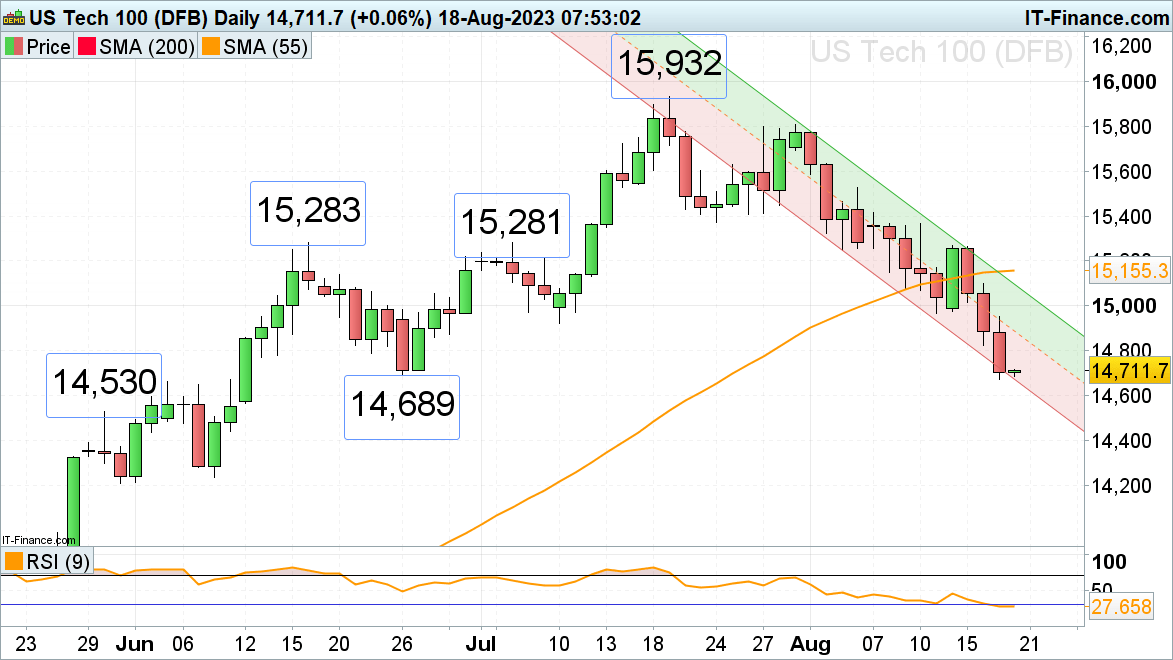
Nasdaq 100 slips to two-month lows
The Nasdaq 100’s summer decline is ongoing as risk-off sentiment dominates among rising longer-dated US bond yields. The Nasdaq 100 on Thursday briefly reached levels last traded in mid-June and nearly touched the early June high at 14,663. Below it further minor support can be found around the 14,530 late May high.
Resistance sits at the July low at 14,920.
Nasdaq 100 Daily Chart