


S&P 500 Index, SPX - Price Outlook:
- 83% of the members in the S&P 500 index are above their respective 10-week moving average.
- MACD of 84% of the members in the S&P 500 index are above zero.
- What does it mean for the index’s trend?

Improving market breadth points to further gains in the S&P 500 index in the coming weeks as the earnings season picks up steam.
As of Monday, slightly over 83% of the members in the S&P 500 index were above their respective 10-week moving average (WMA). Data from 1996 onwards suggests that when 83%-84% of the members were above their respective 10-WMAs, the index has been up 74% of the time over the subsequent 30 days. That is, in such instances, 74% of the time the index returns have been positive over the subsequent one-month period based on historical performance (see the distribution plot).
Distribution plot of S&P 500 index returns when 83%-84% of members are above their respective 10-week moving average
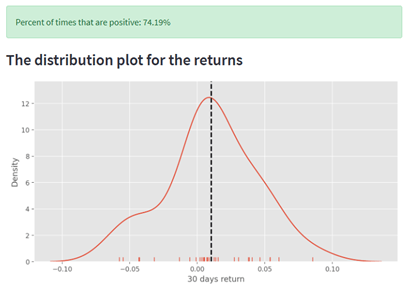
Data Source: Bloomberg; Chart Created by Manish Jaradi in Python
Similarly, data from 1996 onwards suggests that when 83%-84% of the members were above their respective 10-WMAs, the index has been up 64% of the time over the subsequent 60 days. That is, in such instances, 64% of the time the index returns have been positive over the subsequent two-month period based on historical performance (see the distribution plot).
Distribution plot of S&P 500 index returns when 83%-84% of members are above their respective 10-week moving average
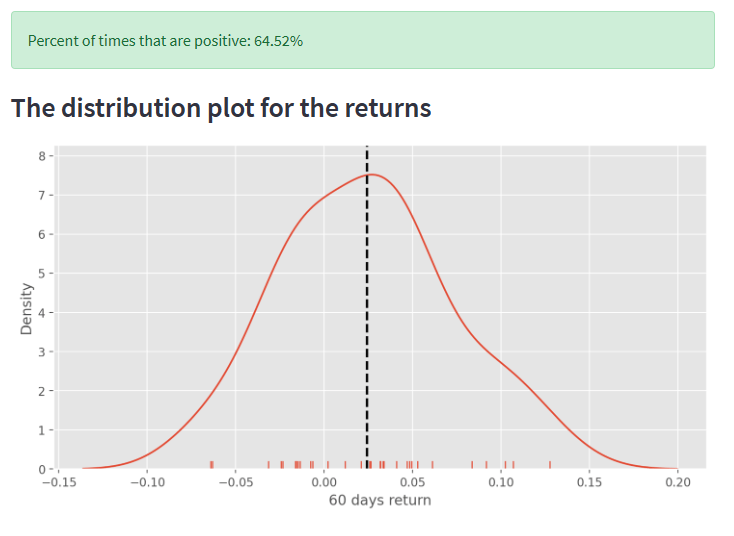
Data Source: Bloomberg; Chart Created by Manish Jaradi in Python
Furthermore, as of Monday, the Moving Average Convergence Divergence indicator (MACD) of 84% of the members in the S&P 500 index was zero. Data from 1996 onwards suggests that when 83%-84% of the members had their MACDs above zero, the index has been up 57% of the time over the subsequent 30 days. That is, in such instances, 57% of the time the index returns have been positive over the subsequent one-month period based on historical performance (see the distribution plot).
Distribution plot of S&P 500 index returns when 83%-84% of members have MACD above zero
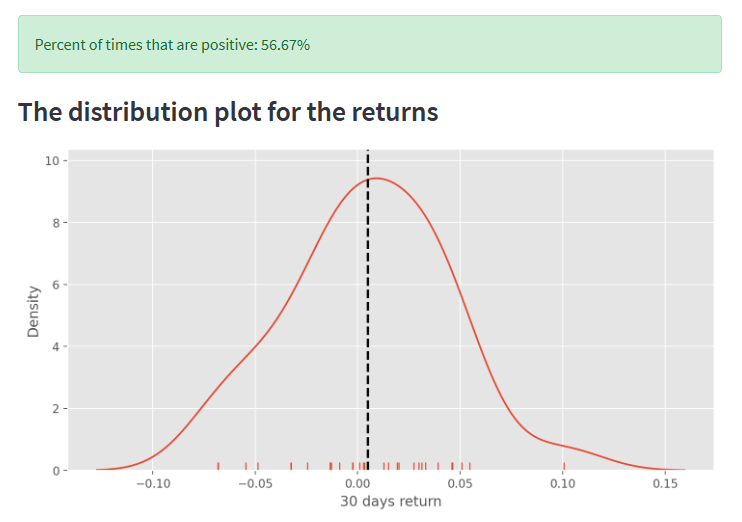
Data Source: Bloomberg; Chart Created by Manish Jaradi in Python
Similarly, data from 1996 onwards suggests that when 83%-84% of the members had their MACDs above zero, the index has been up 70% the time over the subsequent 60 days. That is, in such instances, 70% of the time the index returns have been positive over the subsequent two-month period based on historical performance (see the distribution plot).
Distribution plot of S&P 500 index returns when 83%-84% of members have MACD above zero
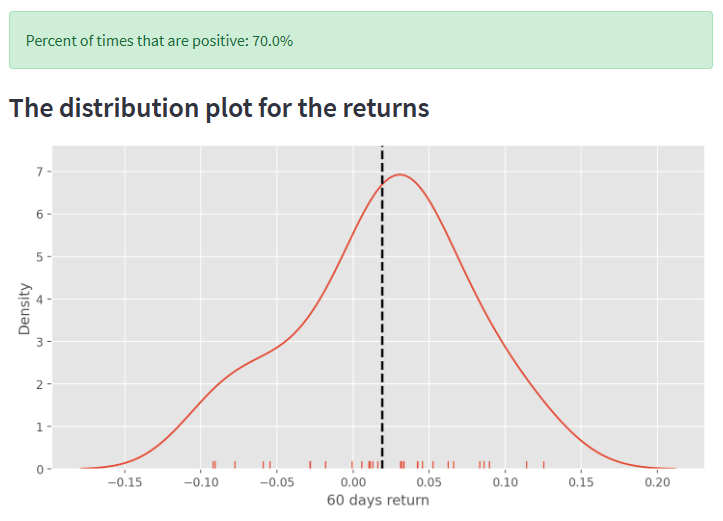
Data Source: Bloomberg; Chart Created by Manish Jaradi in Python

--- Written by Manish Jaradi, Strategist for DailyFX.com
--- Contact and follow Jaradi on Twitter: @JaradiManish


