


US Stocks Talking Points:
- S&P 500 futures fall to psychological support after failing to rise above the upper bound of the falling wedge.
- Dow Jones eyes 34000 while bullish momentum stalls.
- Nasdaq 100 slides below 12000 as bears drive price action to 11850.

US Stock Futures Fall as Fed Expectations Rise
S&P 500, Nasdaq 100 and Dow futures are trading lower as Dollar strength returned to markets. With the recent move triggered by Friday’s NFP (non-farm payrolls) report, rate expectations and recession risks continue to drive sentiment.
While the Federal Reserve remains fixated on achieving price stability, surging wage growth and a resilient labor market has contributed to rising inflation. As Fed officials maintain a hawkish narrative, higher yields and USD strength continues to threaten the growth trajectory for stocks.
Monitor central bank announcements via the central bank calendar
Although market participants continue to adjust to changes in the fundamental backdrop, technical levels have provided an additional catalyst for price action.

S&P 500 Technical Analysis
After a strong rebound off the October low at 3502 triggered a two-month rally that allowed bulls to drive price action into a barrier of trendline resistance holding at 4110. With S&P 500 futures trading within the confines of a falling wedge, a rejection of this level has allowed bears to push prices lower.
As prices hover around the 200-day MA (moving average) level of 4047, support holds at the 61.8% Fibonacci retracement of the 2022 move around the 4000 psychological level.
S&P 500 Daily Chart
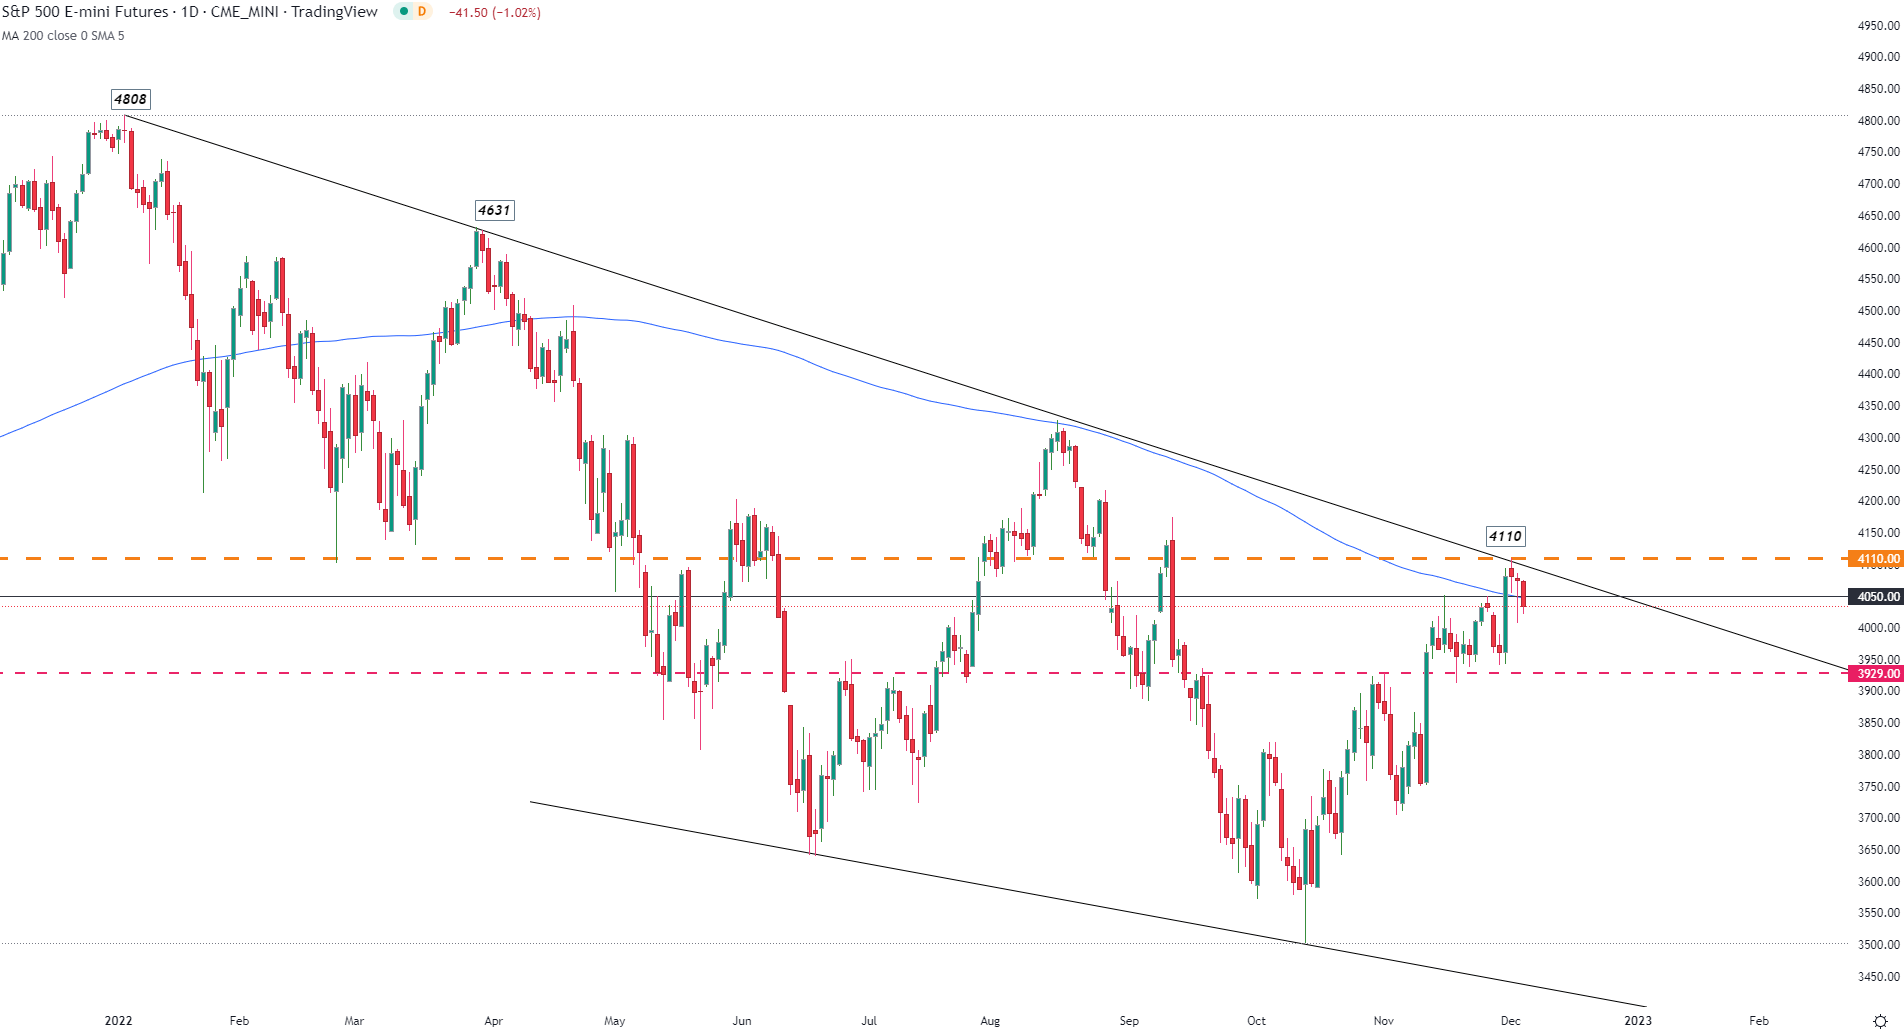
Chart prepared by Tammy Da Costa using TradingView
Dow Jones Industrial Average (DJI)Technical Analysis
With Dow futures trading between 34246 and 34463, the uptrend remains intact. As the extended wicks signifying important zones where bulls and bears collided, price action remains in a well-defined range. While this zone could be imperative for the short-term move, a break of 34463 could bring the December high into play as resistance at 34707.
Dow (US30) Daily Chart
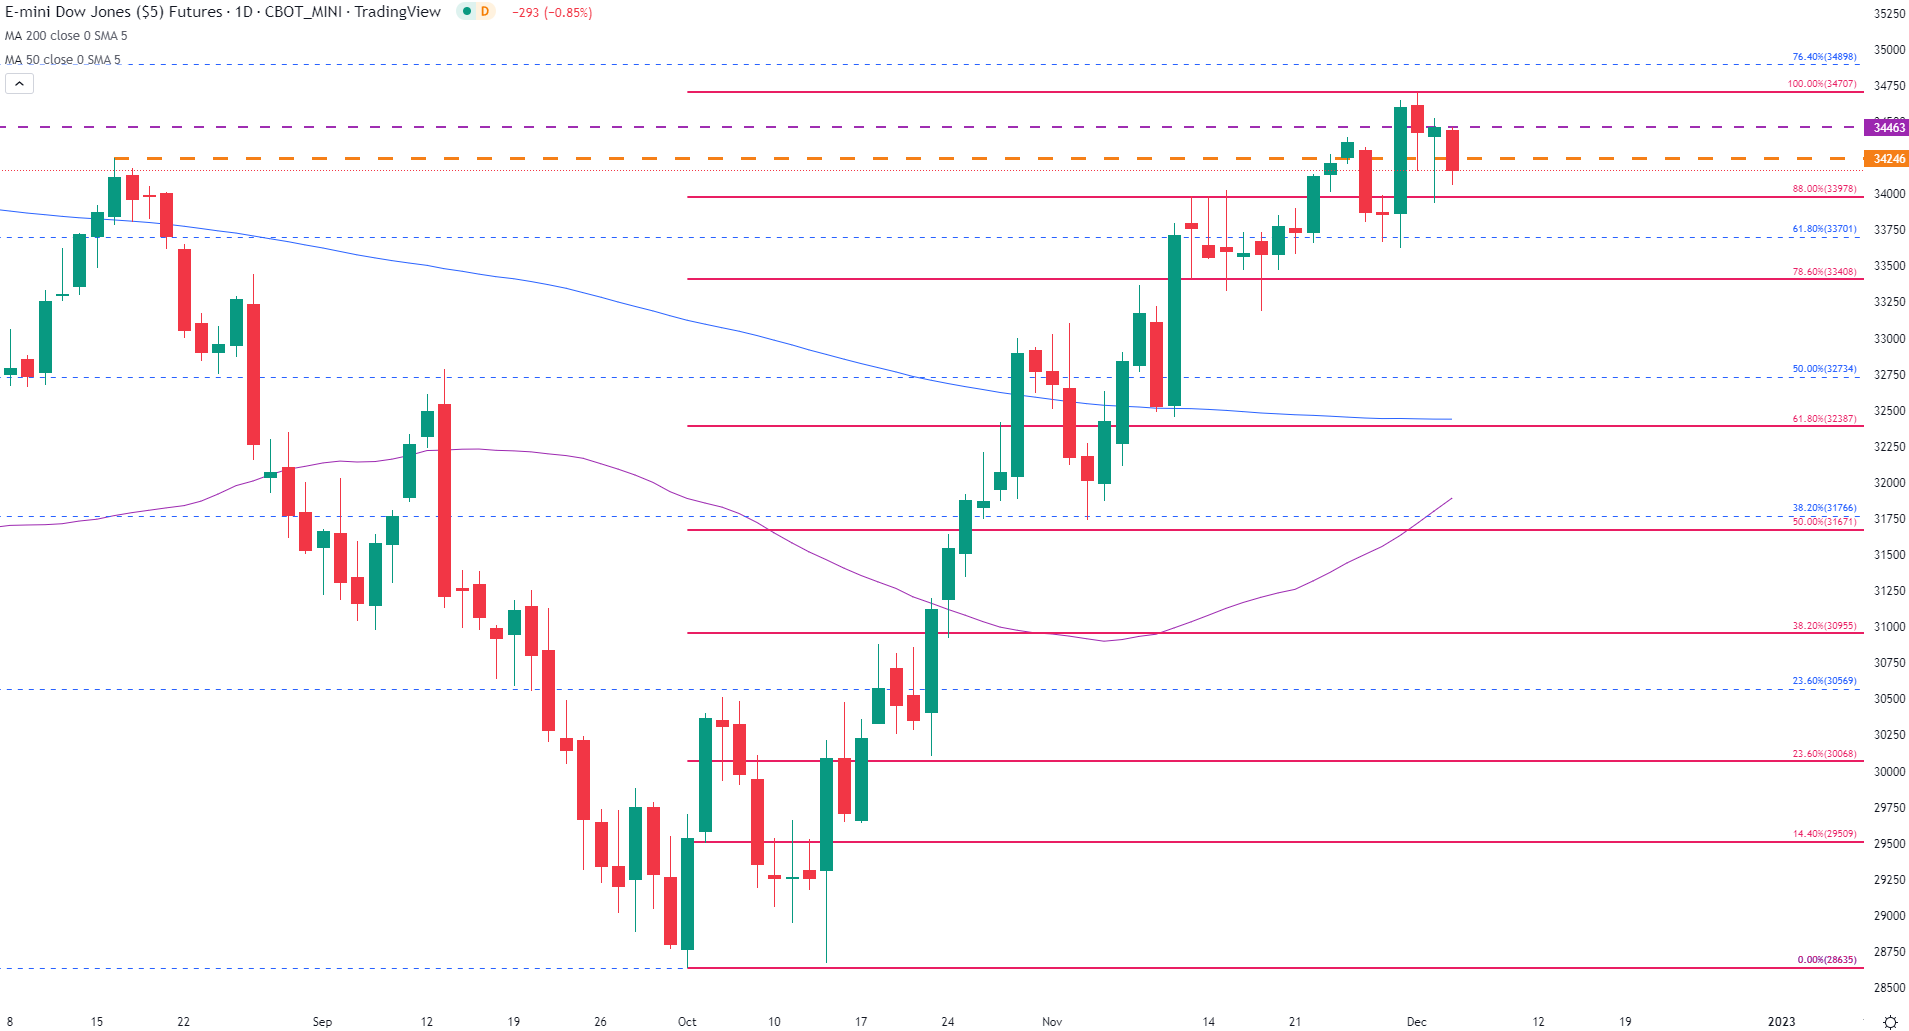
Chart prepared by Tammy Da Costa using TradingView
Meanwhile, if bears can drive prices below the key psychological level of 34000, an increase of bearish momentum could drive price action back towards 33700.
Nasdaq 100 Technical Analysis
As Nasdaq futures fall to a daily low 11850.25, the current monthly low of 11740 remains as support with a drop below allowing for a probable retest of 11500. For bulls to take control, a hold above 12000 and above 12145 is necessary, paving the way for 12260.
Nasdaq (US100) Daily Chart
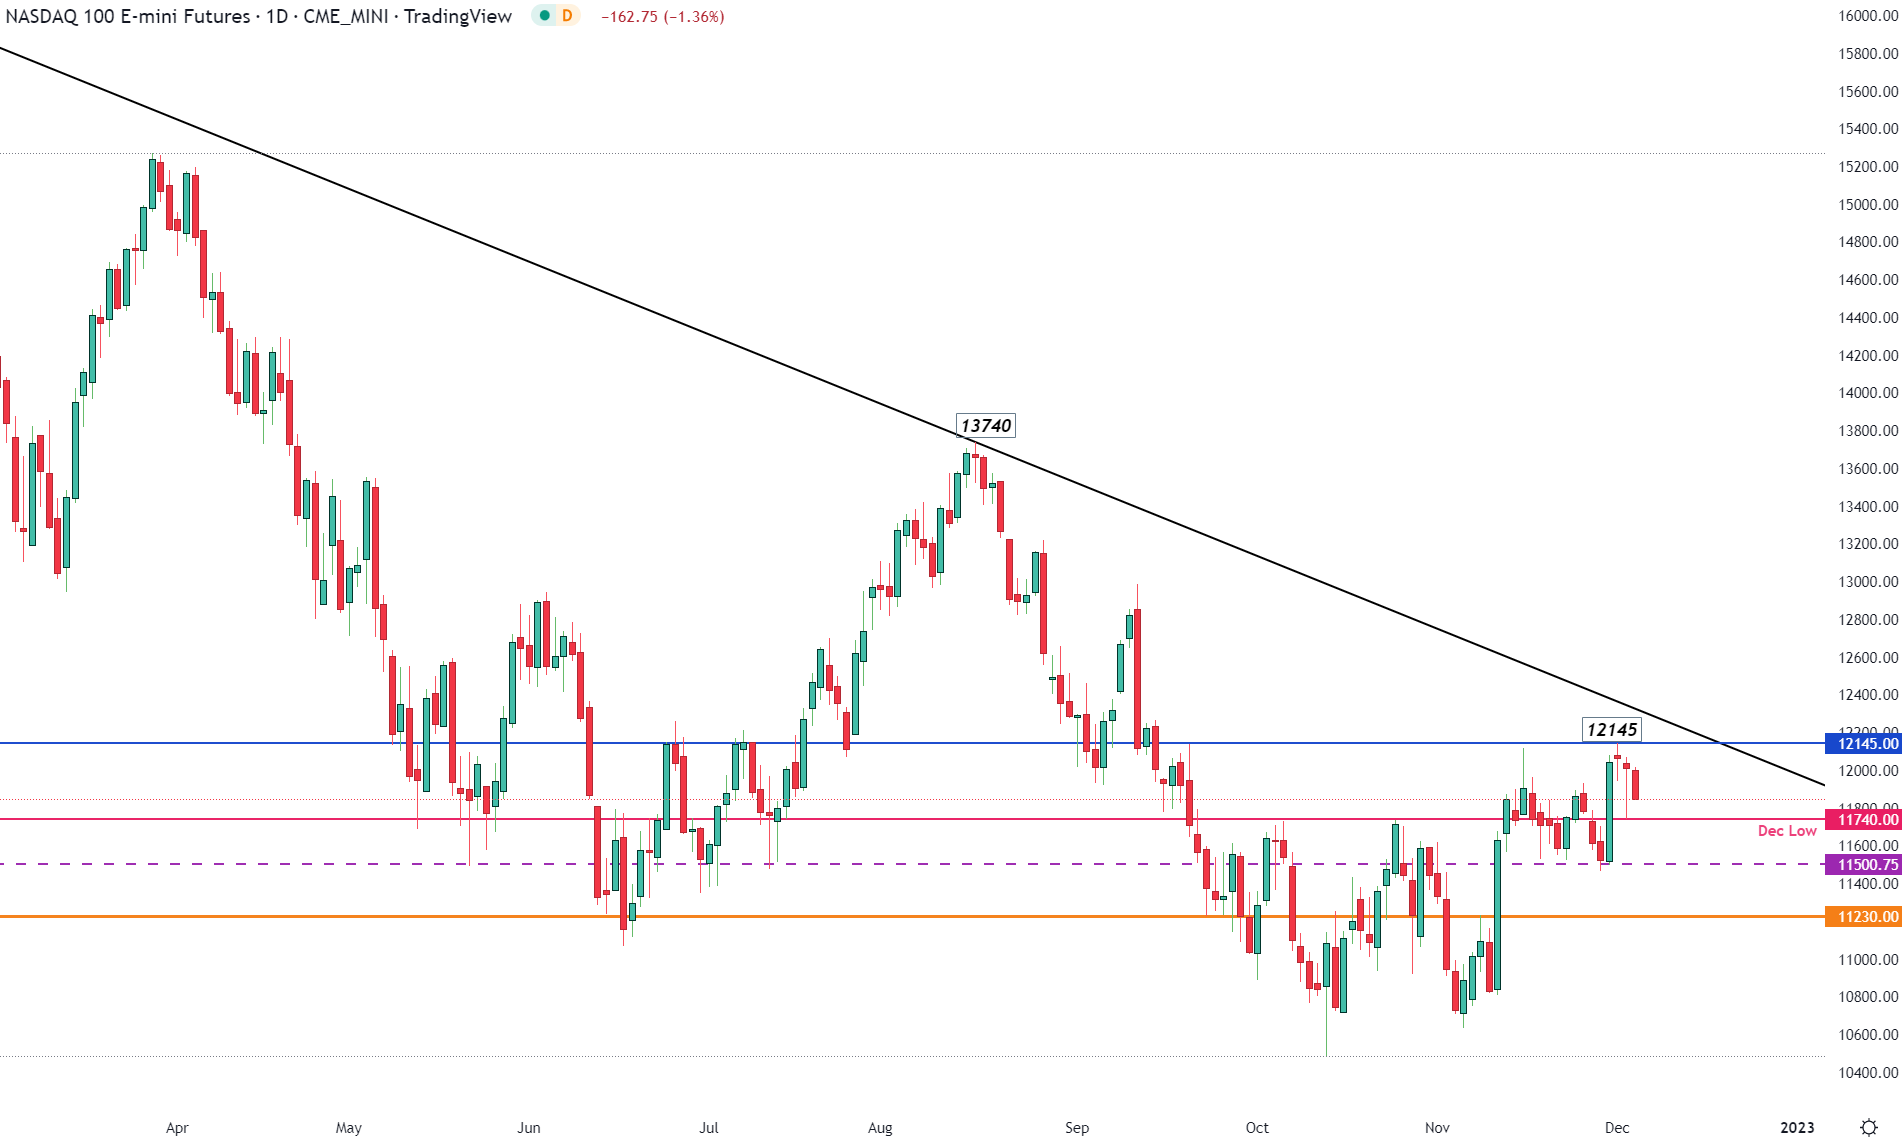
Chart prepared by Tammy Da Costa using TradingView

--- Written by Tammy Da Costa, Analyst for DailyFX.com
Contact and follow Tammy on Twitter: @Tams707


