


S&P 500, Nasdaq Analysis
- S&P 500 poised to test long-term resistance on big tech earnings
- Economic data/ events can align to propel US stocks further this week
- The analysis in this article makes use of chart patterns and key support and resistance levels. For more information visit our comprehensive education library

S&P 500 Poised to Test Long-Term Resistance on Big Tech Earnings
The S&P 500 continues its impressive uptrend, trading largely within the ascending channel. In recent weeks, prices have accelerated within the broader uptrend, testing the upper bound of the channel once more before pulling back at the end of last week. Once again this zone comes into focus – the zone of confluence between 4550 and the 78.6% Fibonacci retracement of the 2022 selloff (4589. In fact, this zone now appears as support as prices appear poised for another test of channel resistance around 4600/4610 as the weekly RSI edges on overbought territory.
S&P 500 (E-Mini Futures) Weekly Chart
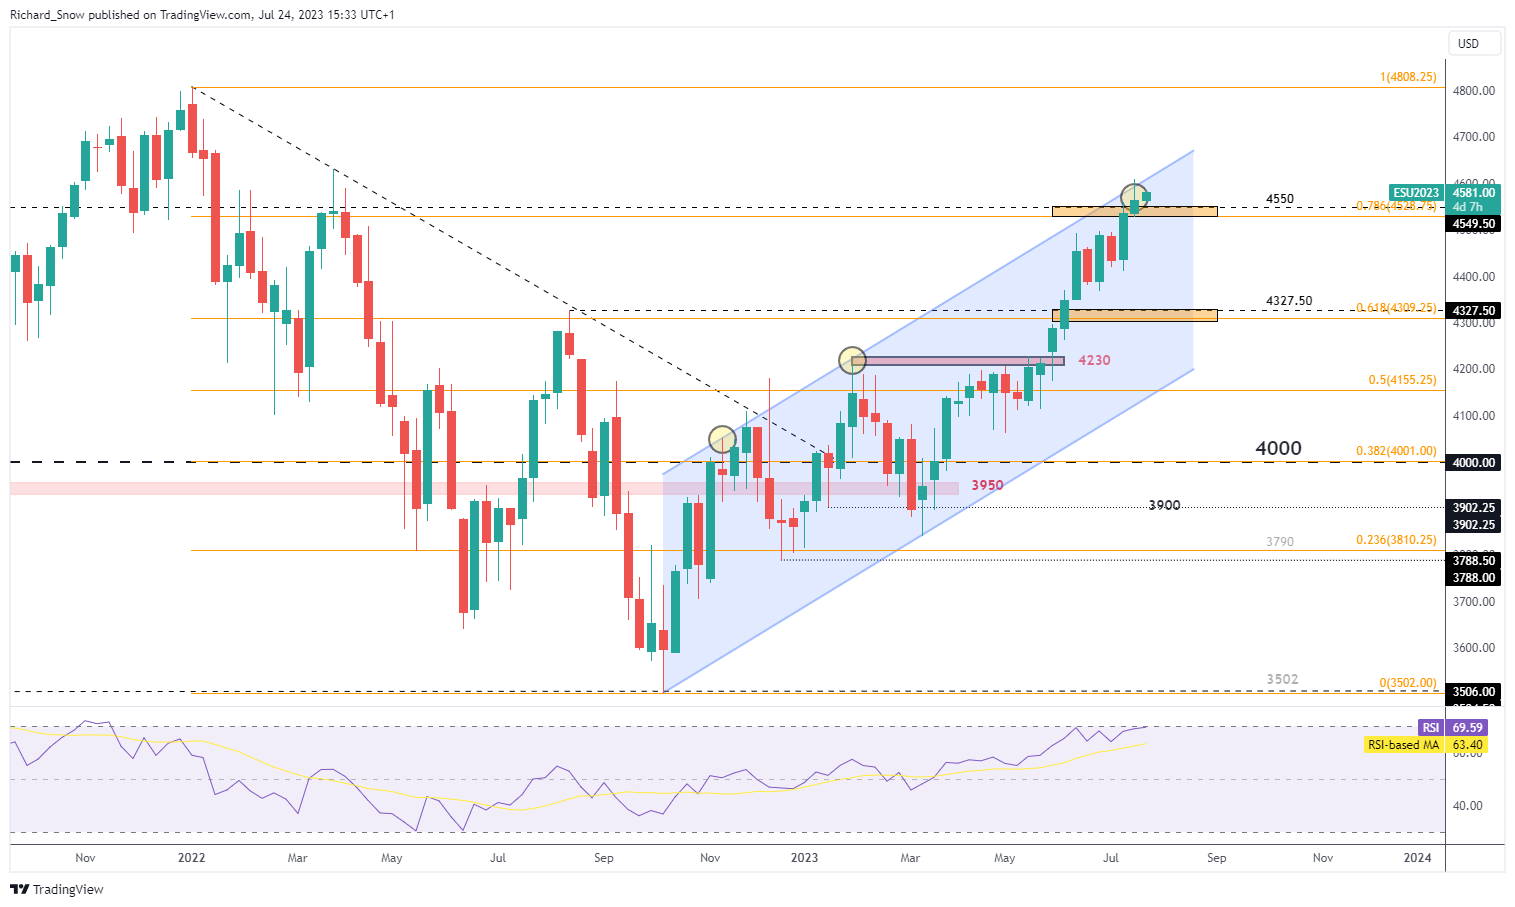
Source: TradingView, prepared by Richard Snow
On the weekly chart, the re-acceleration of the bullish trend can be seen despite the shallow pullback brought about by less than stellar Tesla and Netflix earnings. 4550 has held as immediate support with 4609 setting the bar for the bullish continuation.
S&P 500 (E-Mini Futures) Daily Chart
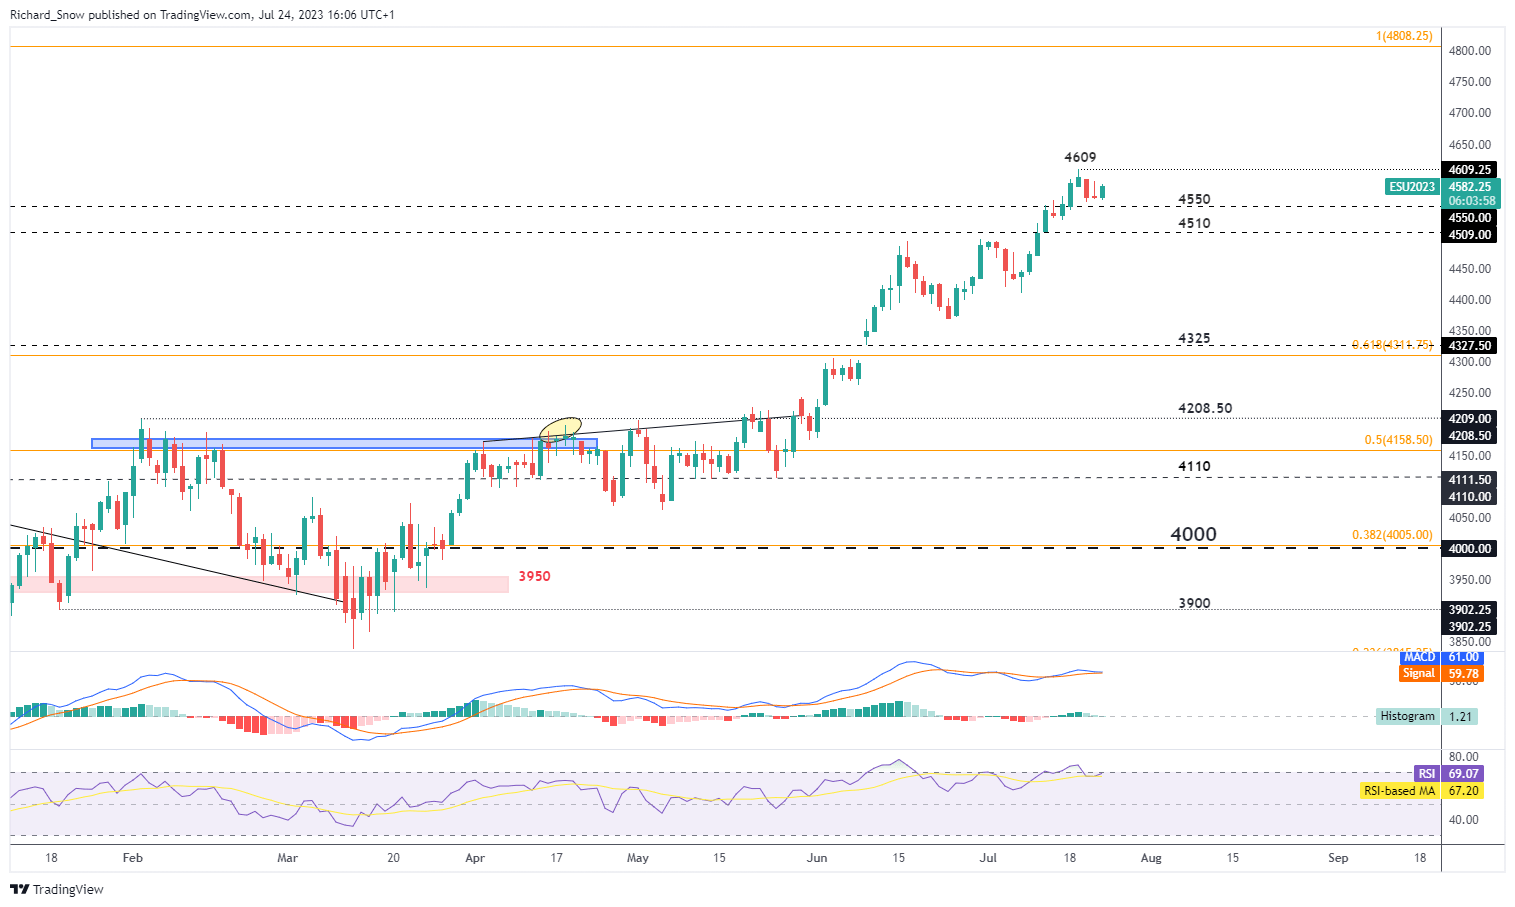
Source: TradingView, prepared by Richard Snow
Economic Data/Events Can Align to Propel the Nasdaq Higher Still
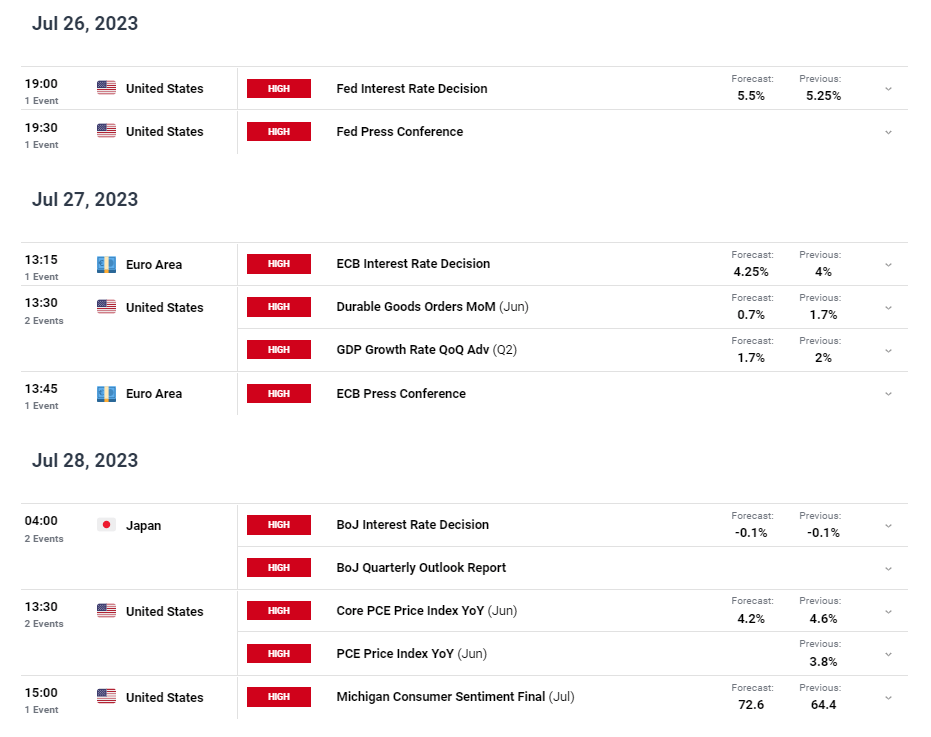
This week potentially presents a tailwind for stocks if economic data prints in line with broad consensus. Softer core CPI, better-than-expected EPS for Microsoft, Tesla and Meta and slightly weaker US GDP data could work together to send equity valuations higher still. The main risk however, is a strongly hawkish message from the Fed on Wednesday. The Fed’s median dot plot has rates at 5.6% which suggests a final rate hike after July could be relied upon to keep markets on their toes.
Nasdaq, unsurprisingly trades in a similar fashion to the S&P 500, testing channel resistance before cooling off at the end of last week. The 78.6% Fibonacci retracement of the broad 2022 selloff (15,420) presents itself as immediate support followed closely by 15,260. The RSI is yet to recover from overbought territory and does not appear to show any tendency to do so either.
Nasdaq (E-Mini Futures) Weekly Chart
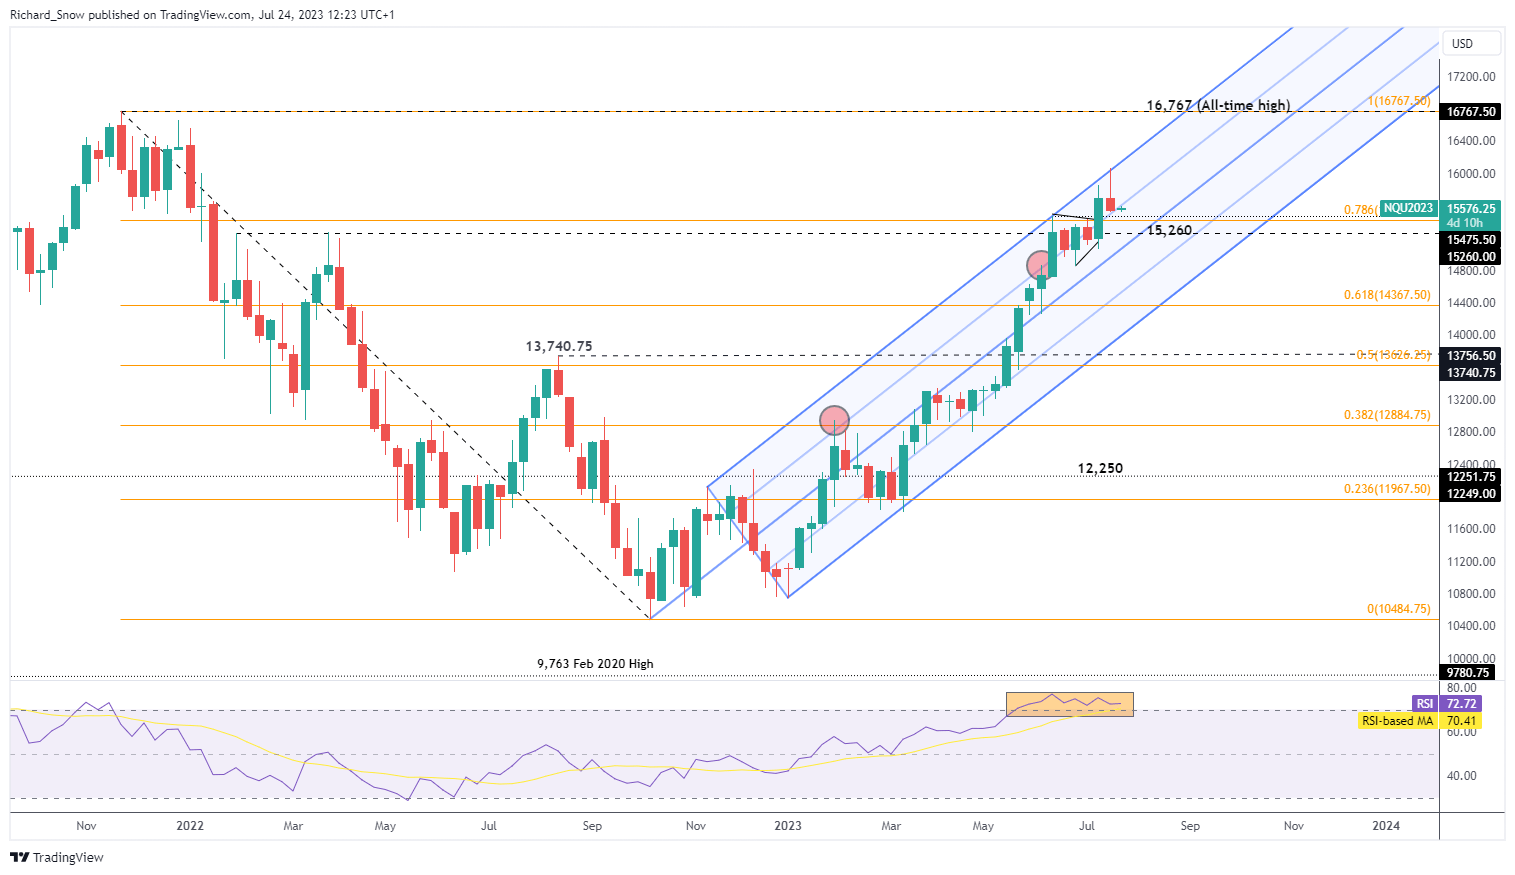
Source: TradingView, prepared by Richard Snow

Honourable mentions on the docket this week includes US PCE data and US Q2 GDP data.
Customize and filter live economic data via our DailyFX economic calendar
Trade Smarter - Sign up for the DailyFX Newsletter
Stay up to dat with the latest news and market moves
--- Written by Richard Snow for DailyFX.com
Contact and follow Richard on Twitter: @RichardSnowFX


