


S&P 500 and Nasdaq 100 Forecasts and Analysis

The US equity markets have drifted lower this week as the holiday season nears. A lack of any Fed insight, due to the blackout period ahead of next Wednesday’s FOMC decision, has not helped and volatility is on the wane. Next week’s US CPI (Tuesday) and Fed meeting (Wednesday) will likely be the last dominant market events ahead of the season break, and unless chair Powell says something unexpected, or inflation beats/misses expectations by a margin, then traders may take one last shot at the market before closing their books.
This week’s prevailing narrative has been the removal of a host of zero-covid policies in China against growing recession fears in the US. The good news out of China quickly dissipated as markets began to look through the removal of lockdown measures and focus on the deteriorating growth prospects for the world’s second-largest market by GDP. Recent Chinese PMI readings showed business activity slowing further, while Wednesday’s balance of trade surplus figure fell as exports and imports disappointed.
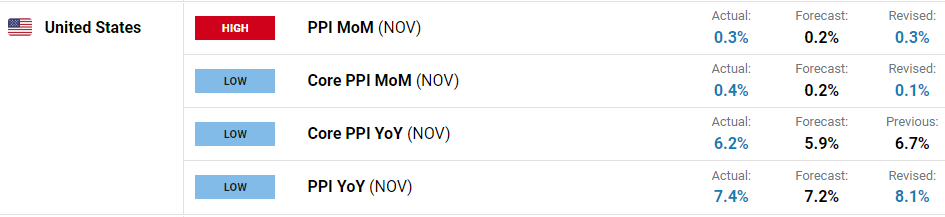
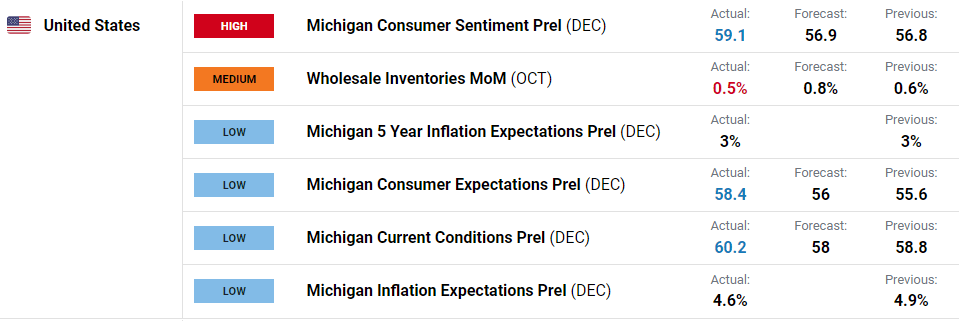
With no Fed chatter this week, data took over as the driver of any move. Last Friday’s robust NFPs gave the US dollar, and US Treasury yields, a lift, hitting equity sentiment, while this week’s US ISM figure beat expectations and further bolstered the dollar. Friday’s data was a mixed to positive bag with PPI above forecasts, while Michigan consumer sentiment beat expectations and one-year inflation expectations fell. The ‘good news is bad news for the market’ narrative may now come back into vogue with hawks seeing the opportunity to hike rates further against the background of a strong-than-expected economy.
The DailyFX Economic Calendar needs to be followed carefully next week.
Most Read: S&P 500 and Nasdaq 100 Latest – Bearish Sentiment Prevails Ahead of The Fed
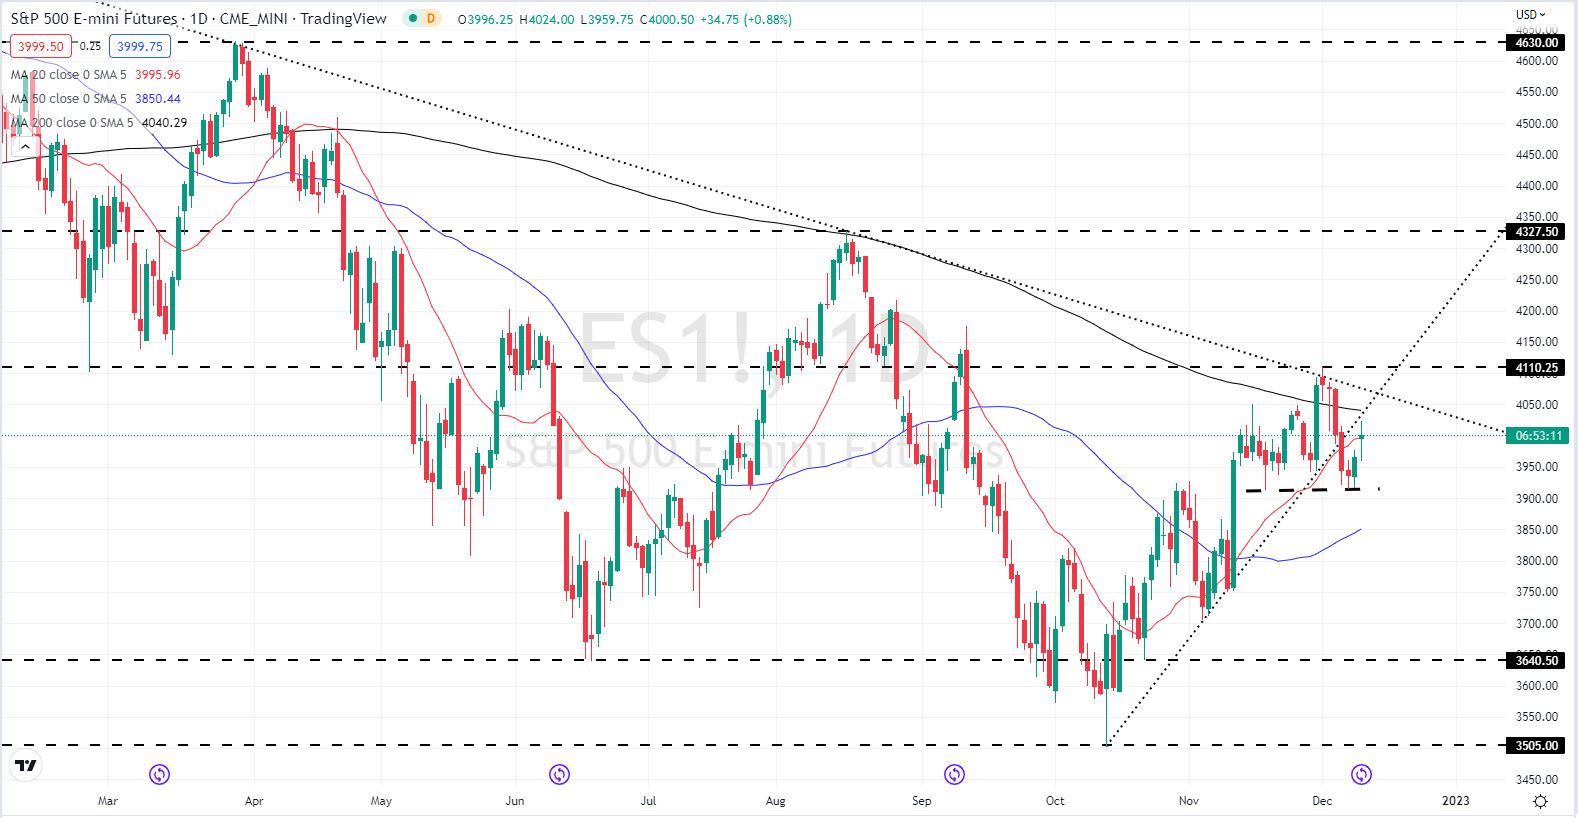
The S&P 500 remains supported around the 3,912 level that has been tested of late. The longer-term downtrend remains dominant while the indices have slipped below the short-term uptrend.
S&P 500 E-mini Futures Daily Price Chart – December 9, 2022
| Change in | Longs | Shorts | OI |
| Daily | 1% | -1% | 0% |
| Weekly | 15% | -13% | -1% |
Retail trader data shows 51.84% of traders are net-long with the ratio of traders long to short at 1.08 to 1.The number of traders net-long is 4.34% lower than yesterday and 30.96% higher from last week, while the number of traders net-short is 2.54% higher than yesterday and 11.70% lower from last week.
We typically take a contrarian view to crowd sentiment, and the fact traders are net-long suggests US 500 prices may continue to fall. Positioning is less net-long than yesterday but more net-long from last week. The combination of current sentiment and recent changes gives us a further mixed US 500 trading bias.
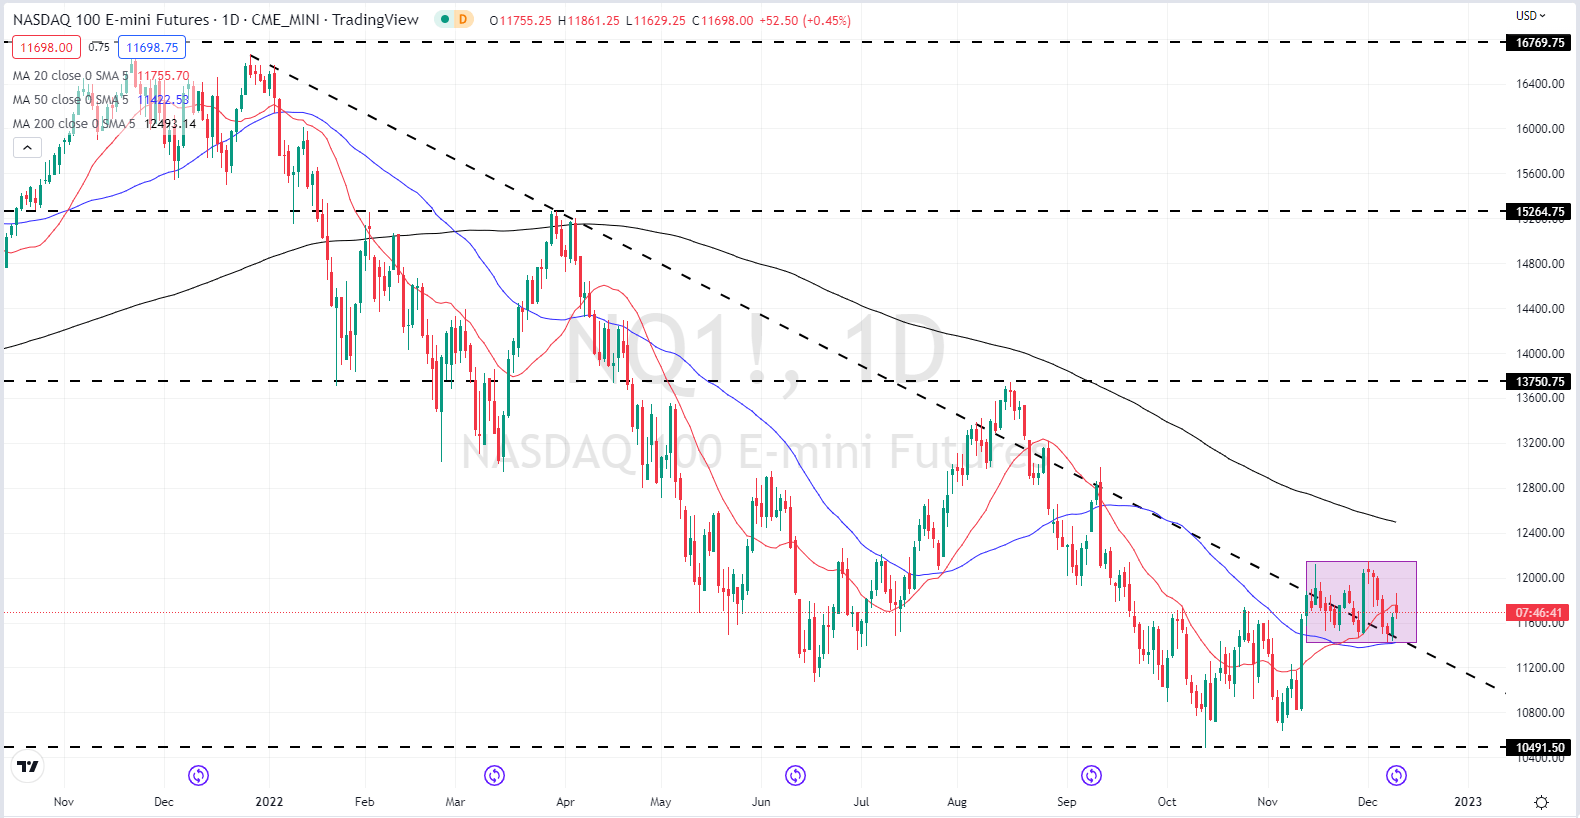
The Nasdaq 100 has been stuck in a box formation for the last month and is likely to stay that way unless next week’s CPI and/or FOMC decision throws the tech index a break. While recent price action shows a bullish flag set-up, the strong downtrend continues to weigh on the Nasdaq.
Nasdaq 100 E-mini Futures Daily Price Chart – December 9, 2022
For all market-moving data releases and economic events see the real-time DailyFX Calendar.
What is your view on US Indices – bullish or bearish?? You can let us know via the form at the end of this piece or you can contact the author via Twitter @nickcawley1.


