S&P 500, SPX, NASDAQ 100, NDX, DJIA - OUTLOOK:
- The S&P 500 and DJIA have fallen below key support.
- The Nasdaq 100 index risks a bearish head & shoulders pattern.
- What are the outlook and the key levels to watch in the three US indices?

The rally in US indices appears to be cracking – the S&P 500 and the Dow Jones Industrial Average (DJIA) have broken below key support, while the Nasdaq 100 index looks vulnerable amid a potential bearish formation. For more discussion on the fundamental drivers, see “US Indices Risk Support Test After Hawkish Fed: S&P 500, Nasdaq Price Action,” published September 21.
S&P 500: Falls below key support
The S&P 500 has fallen below a vital converged support, including the June low of 4325, the 89-day moving average and the lower edge of the Ichimoku cloud on the daily charts –a risk highlighted in the last week’s update. The break is critical as the higher-top-higher-bottom sequence since the beginning of the year has been broken. The break has opened the way toward the 200-day moving average initially, now at about 4195. Below that, the next support is at the end-April low of 4050.
S&P 500 Daily Chart
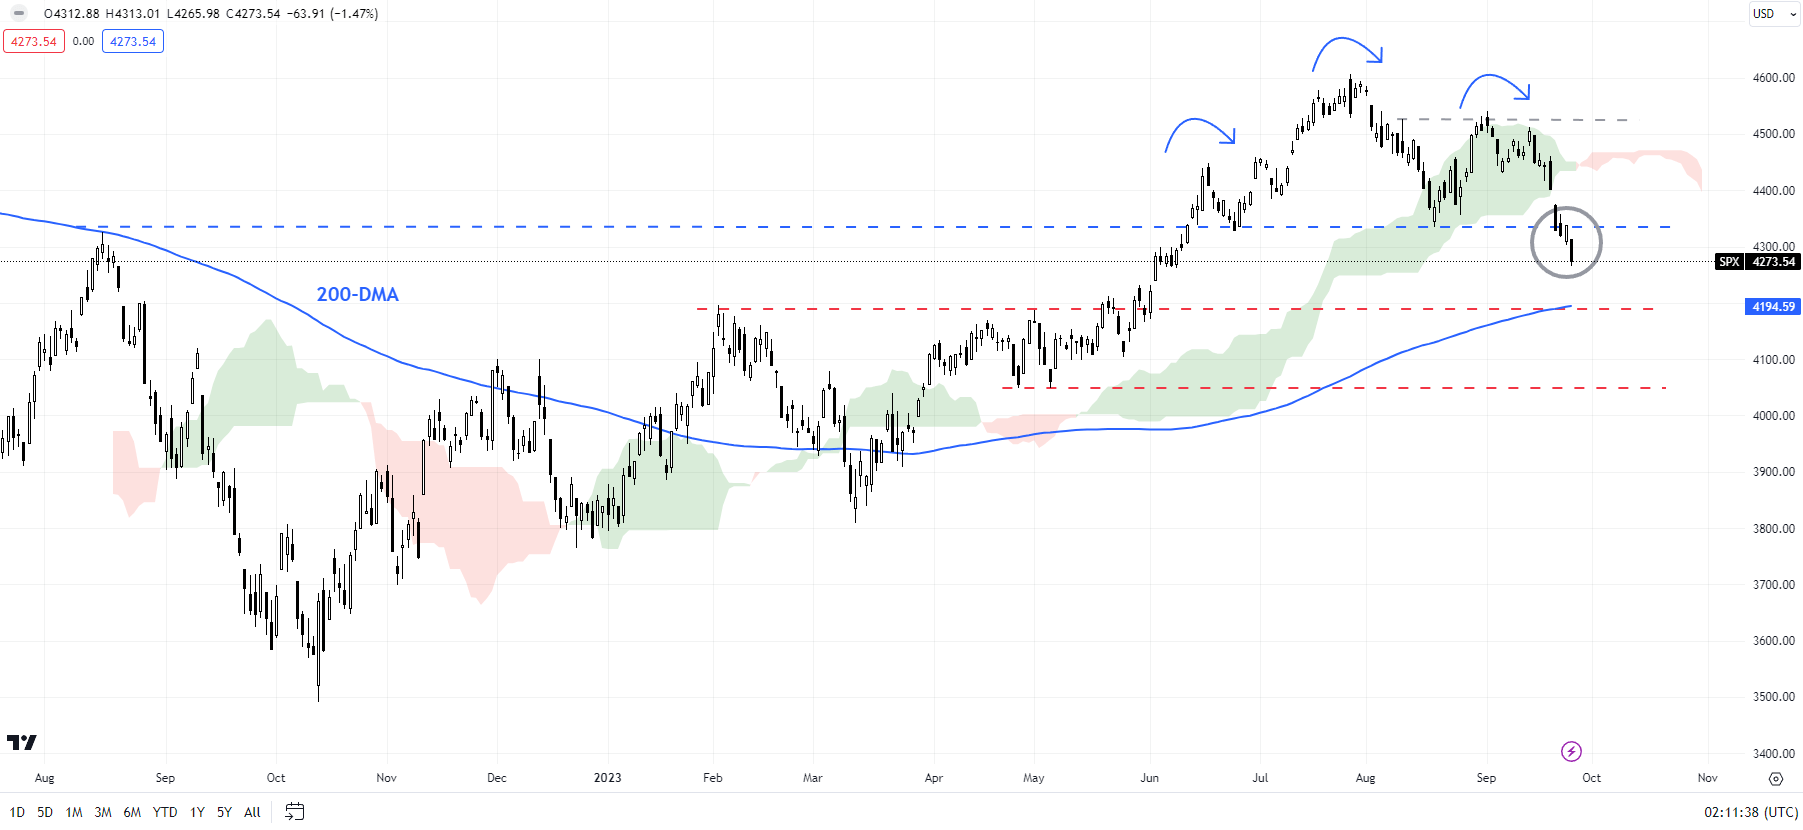
Chart Created by Manish Jaradi Using TradingView
The evolving price action further reinforces the broader fatigue on higher timeframe charts, as pointed out in previous updates. See “US Indices Hit a Roadblock After Solid Services Print: S&P 500, Nasdaq,” published September 7; “US Indices Rally Beginning to Crack? S&P 500, Nasdaq Price Setups,” published August 3; “S&P 500, Nasdaq 100 Forecast: Overly Optimistic Sentiment Poses a Minor Setback Risk,” published July 23.
Nasdaq 100: Head & Shoulders Risk
The Nasdaq 100 index is testing a crucial horizontal trendline from June (at about 14550-14560). Any break below would trigger a head & shoulders pattern – the left shoulder is at the June high, the head is at the July high, and the right shoulder is at the early-September high. If triggered, the price objective of the bearish pattern would be around 13200, near the 200-day moving average.
Nasdaq 100 Daily Chart
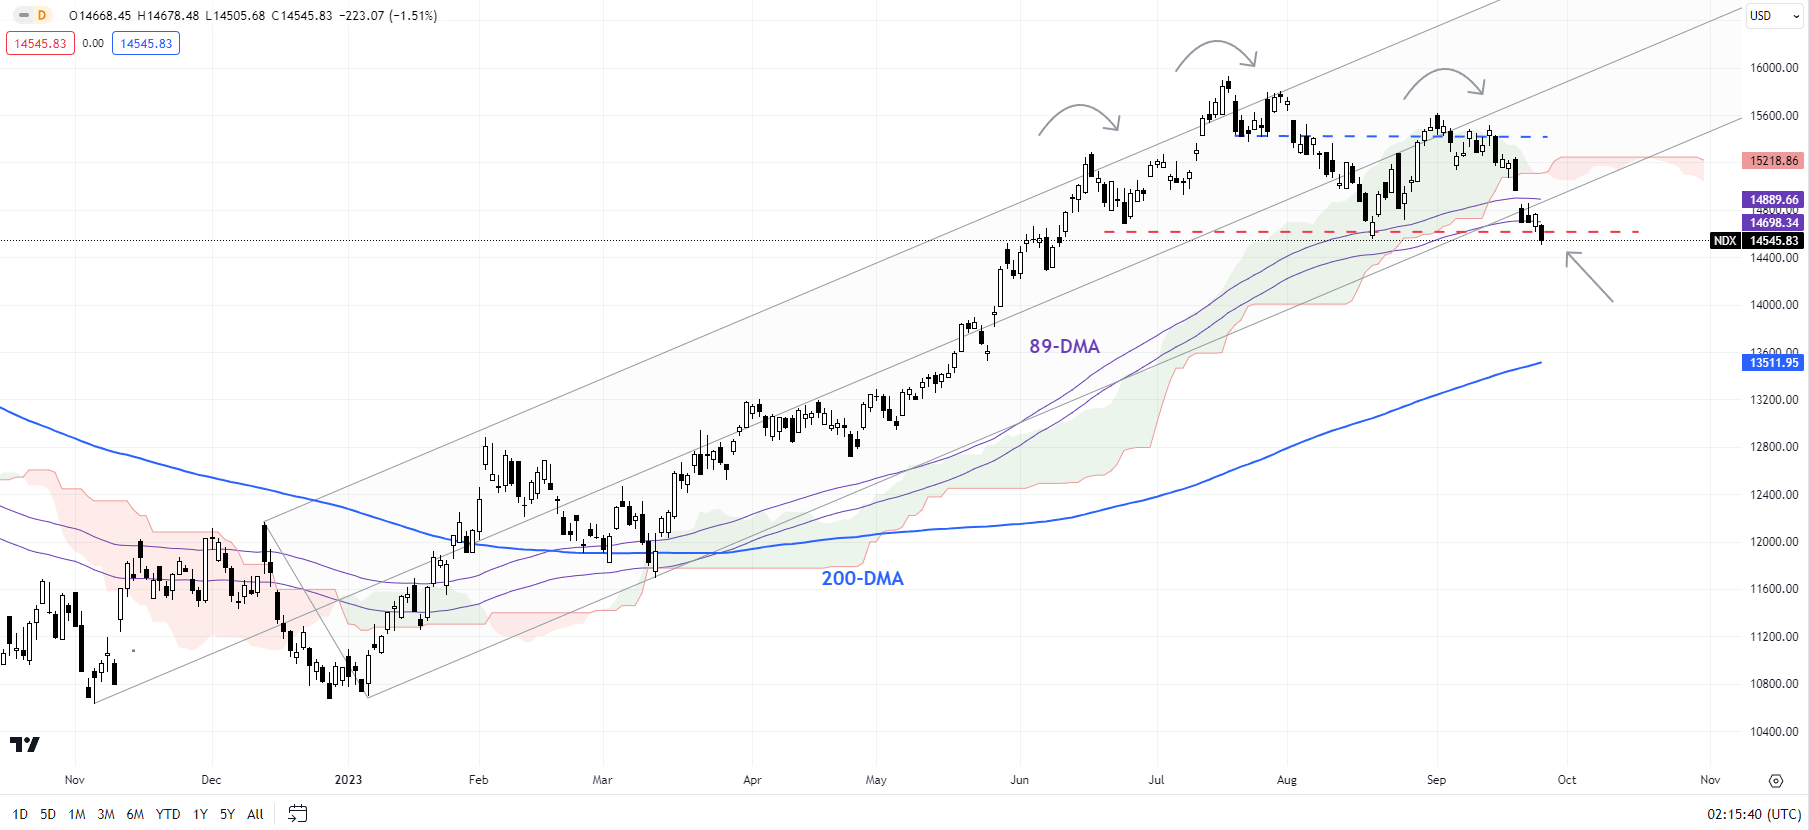
Chart Created by Manish Jaradi Using TradingView
Moreover, from a big-picture perspective, as highlighted in arecent update, the momentum on the monthly charts has been feeble compared with the huge rally since late 2022, raising the risk of a gradual weakening, similar to the gradual drift lower in gold since May. For more discussion, see “Is Nasdaq Following Gold’s Footsteps? NDX, XAU/USD Price Setups,” published August 14.
Dow Jones Industrial Average Weekly Chart

Chart Created by Manish Jaradi Using TradingView
Dow Jones Industrial Average: Cracks below support
After a bullish break in July, the Dow Jones Industrial Average failed to sustain gains. This week the index has fallen below the resistance-turned-support on a horizontal trendline from July (at about 34300). The break has opened the way initially toward the May low of 32600, possibly the 200-week moving average (now at 31720), coinciding with the March low.