

S&P 500, SPX, NASDAQ 100, NDX - OUTLOOK:
- US equity indices pulled back sharply after the Fed stuck with its hawkish rhetoric.
- The S&P 500 index and the Nasdaq 100 look set to test vital support levels.
- What are the outlook and the key levels to watch in the three US indices?

US indices fell after the US Federal Reserve stuck with the hawkish script, projecting one more rate hike before the end of the year and fewer rate cuts than previously indicated. The S&P 500 and the Nasdaq 100 index look set to test support that could define the trend for the coming weeks.
The Fed kept the fed funds rate unchanged at 5.25%-5.5%, in line with expectations while lifting the economic assessment to ‘solid’ from ‘moderate’ and leaving the door open for one more rate hike as ‘inflation remains elevated’. The Summary of Economic Projections showed 50 basis points fewer rate cuts in 2024 than the projections released in June. The Committee now sees just two rate cuts in 2024 which would put the funds rate around 5.1%.
For equities, positive real yields and above-average valuations are likely to pose constraints on a meaningful upside from here. Also, according to some estimates, Fed policy is now in restrictive territory for the first time since the Great Financial Crisis – negative interest rates and accommodative Fed policy have been major tailwinds for equities over the past decade.
S&P 500 240-Minute Chart
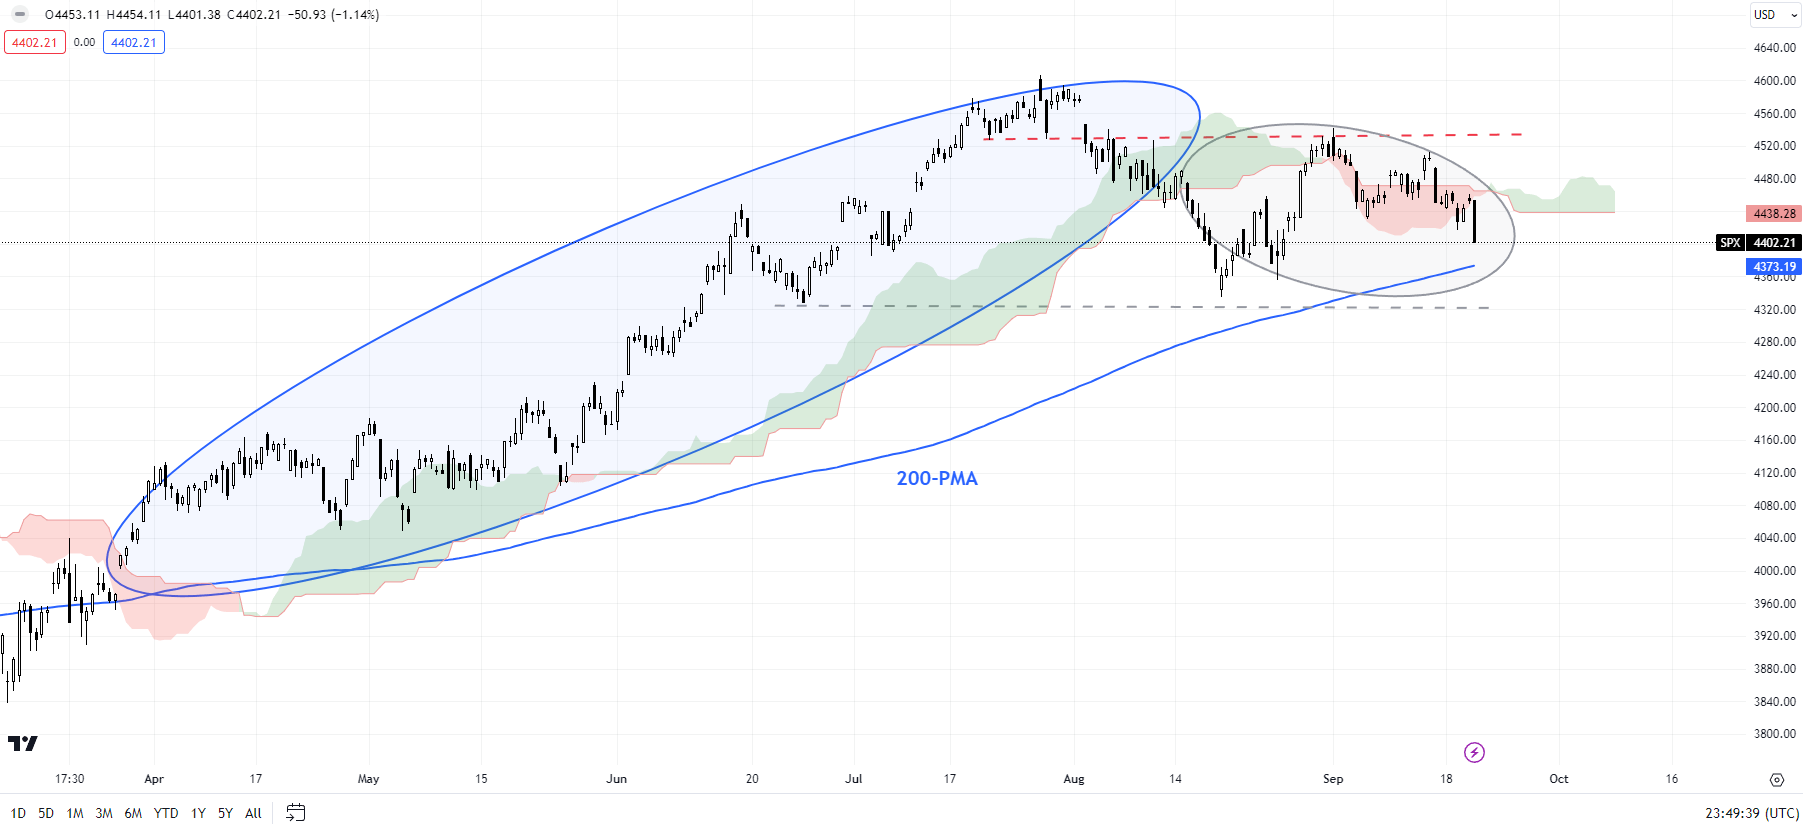
Chart Created by Manish Jaradi Using TradingView.
S&P 500: From Over the top to under the top?
The sharp fall overnight leaves the S&P 500 index vulnerable to a test of vital support converged support on the 200-period moving average on the 240-minute charts, coinciding with the June low of 4325. Furthermore, the changing structure of the uptrend since early 2023 raises the odds of an eventual break below the support.

That is, from remaining above the Ichimoku cloud on the 240-minute charts, the index appears to be shifting to under the cloud. Granted, the price action is still unfolding, and in this regard, a cross below support at 4325 would be key for the broader direction. Such a break could open the door toward the 200-day moving average (at about 4200).
Zooming out, signs of fatigue have emerged in recent weeks, as pointed out in previous updates. See “US Indices Hit a Roadblock After Solid Services Print: S&P 500, Nasdaq,” published September 7; “US Indices Rally Beginning to Crack? S&P 500, Nasdaq Price Setups,” published August 3; “S&P 500, Nasdaq 100 Forecast: Overly Optimistic Sentiment Poses a Minor Setback Risk,” published July 23.
Nasdaq 100 Daily Chart
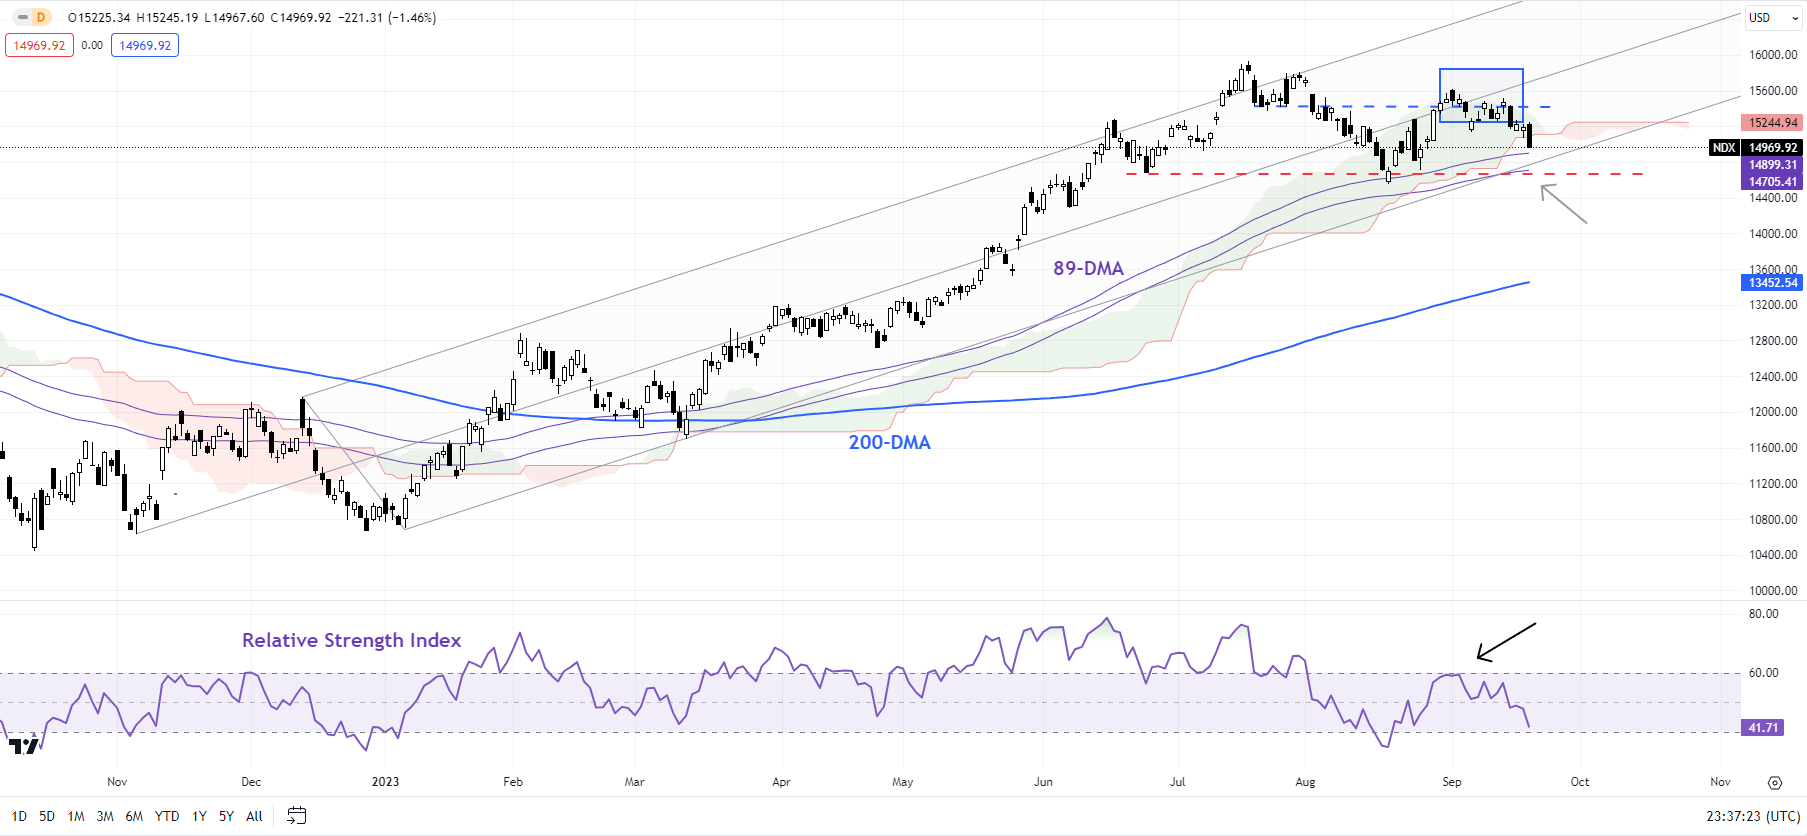
Chart Created by Manish Jaradi Using TradingView
Nasdaq 100: Retreats from a crucial ceiling
The failure of the Nasdaq 100 index to cross above a crucial ceiling on the median line of a rising pitchfork channel since the end of 2022 has opened the gates for a test of converged support, including the 89-day moving average and the August low of 14560. Any break below the support would create a lower high in the index for the first time since the rally began in early 2023.
If the index is unable to break below 14560, then the path of least resistance would remain sideways to up given the Moving Average Convergence Divergence indicator is in positive territory on the weekly charts. However, any break below 14560 could open the way toward the 200-day moving average (now at about 13450).
Zooming out, and looking at the bigger picture, as highlighted in arecent update, the momentum on the monthly charts has been feeble compared with the huge rally since late 2022, raising the risk of a gradual weakening, similar to the gradual drift lower in gold since May. For more discussion, see “Is Nasdaq Following Gold’s Footsteps? NDX, XAU/USD Price Setups,” published August 14.