FTSE 100, DAX 40, and S&P 500 Analysis and Charts
Article written by IG Senior Market Analyst Axel Rudolph

FTSE 100 nears last week’s high
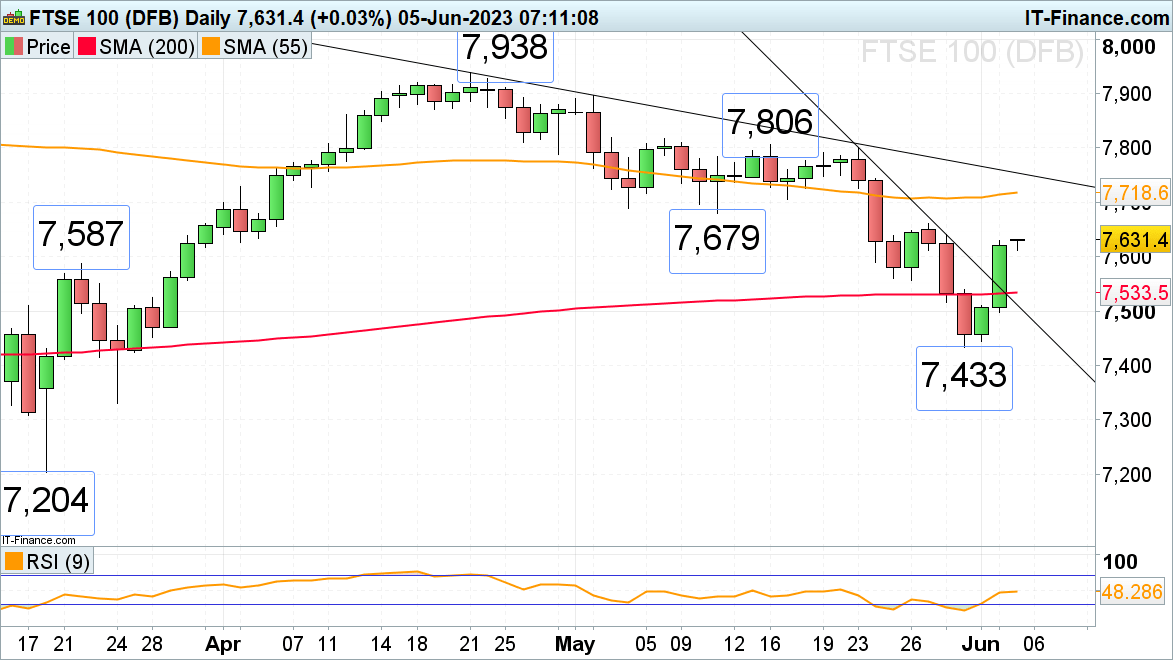
Towards the end of last week the FTSE 100 bounced off its two-month low at 7,433 as the US agreed to raise its debt ceiling, China was preparing new measures to support its property market and solid US labour data but a higher-than-expected unemployment rate at 3.7% and stabilising wage growth gave the US Federal Reserve (Fed) room for a pause in June.
For FTSE 100 bulls to be fully back in control, the high seen a couple of weeks ago at 7,660 would need to be exceeded on a daily chart closing basis this week. Above it lies the 7,679 and 7,706 mid-May lows and meanders the 55-day simple moving average (SMA) at 7,718.
Slips should find around the 26 May low at 7,556 or along the 200-day simple moving average (SMA) at 7,718.
FTSE 100 Daily Price Chart
Trade Smarter - Sign up for the DailyFX Newsletter
Receive timely and compelling market commentary from the DailyFX team
DAX 40 flirts with late May high at 16,080
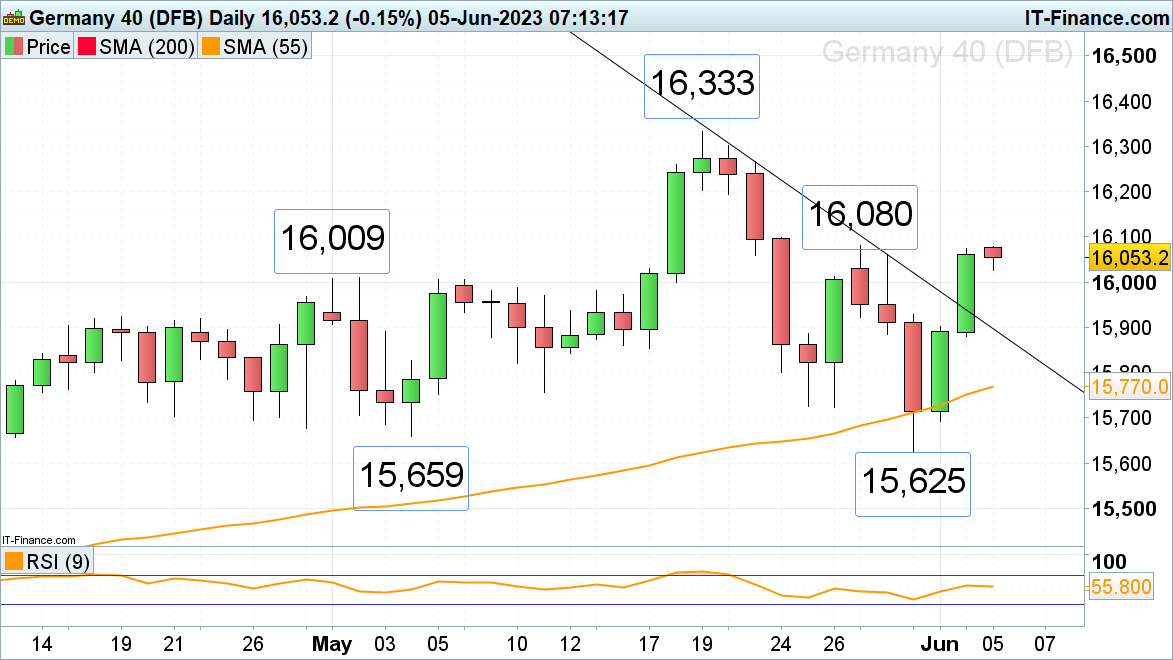
The DAX 40 flirts with its late May high at 16,080, having formed a potentially bullish Hammer formation on the weekly candlestick chart amid broad global risk-on sentiment towards the end of last week.
A rise and daily chart close above the 16,080 high would open the way for the May all-time record high at 16,333 to be reached.
Minor support only comes in around last Wednesday’s high at 15,928, ahead of the breached May-to-June downtrend line at 15,900.
DAX 40 Daily Price Chart
S&P 500 trades near Friday’s nine-month high
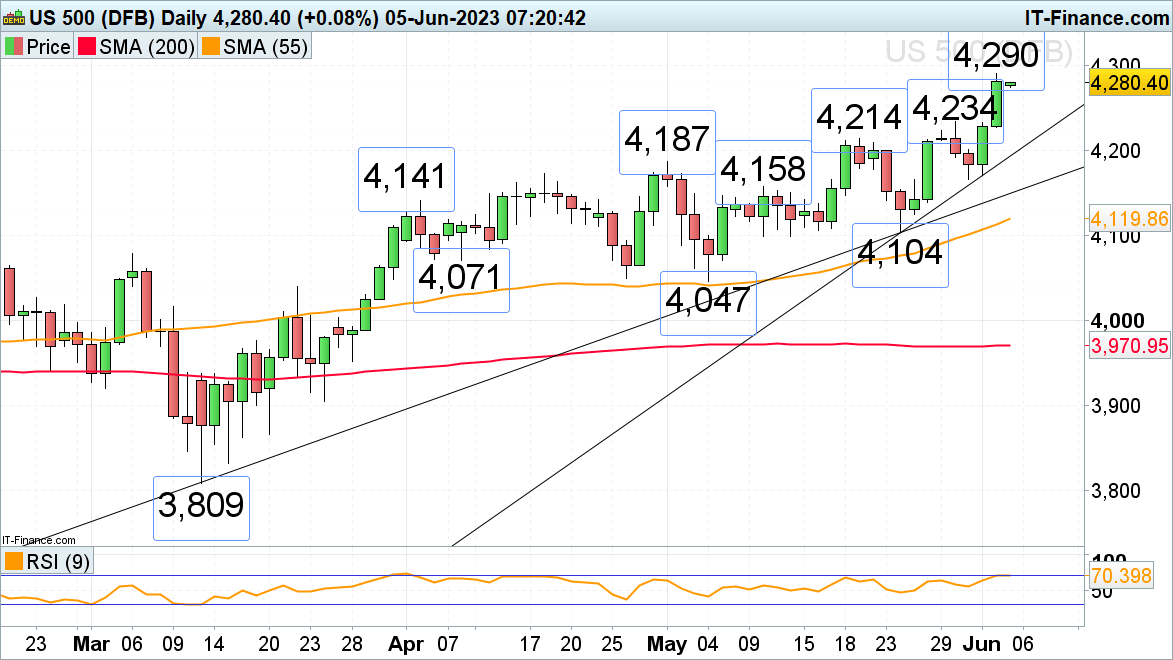
On Friday, the S&P 500 rallied to a nine-month high at 4,290, close to its August 2022 peak at 4,325, both of which will remain in focus as long as risk-on sentiment prevails.
With more and more market participants expecting the Fed not to raise rates at the June meeting and helped by a new Chinese stimulus package for its struggling property market, stock markets continue to look for short-term bids. Potential retracements should find good support between the mid-to-late May highs at 4,234 to 4,214.
S&P 500 Daily Price Chart