


Oil (Brent Crude) Analysis
- Easing US yields, USD and EIA storage data help oil recover losses
- Markets look ahead to Powell’s Jackson Hole speech
- Longer-term outlook for oil remains bullish in a tight market as USD stays elevated
- The analysis in this article makes use of chart patterns and key support and resistance levels. For more information visit our comprehensive education library

Easing US Yields, USD and EIA Storage Data Help Oil Recover Losses
Greater than expected US crude drawdowns helped reverse selling in the US session yesterday, extending early gains that followed from lower US treasury yields and a weaker US dollar. Terrible EU and UK PMI data worsened the economic outlook which typically precedes pessimism around global growth and ultimately oil demand growth of which China is anticipated to contribute 60% of that increase. Therefore, oil markets may continue to react strongly to negative Chinese data as it trickles through.
The daily Brent crude chart tells the story of shorter-term downward direction that has shown signs of fatigue ahead of the $82 level. Yesterday and thus far today, prices reveal an extended lower wick – suggesting a rejection of lower prices for now. However, given that the dollar, while marginally softer, remains resilient as US data tends to outperform estimates. A strong dollar and deteriorating outlook could lead to knee-jerk selling particularly if next week’s Chinese manufacturing PMI data disappoints further. $82 then becomes the focus followed by the 200-day simple moving average. On the upside, the recent spike high around $86 comes in as resistance.
Brent Crude Oil Daily Chart
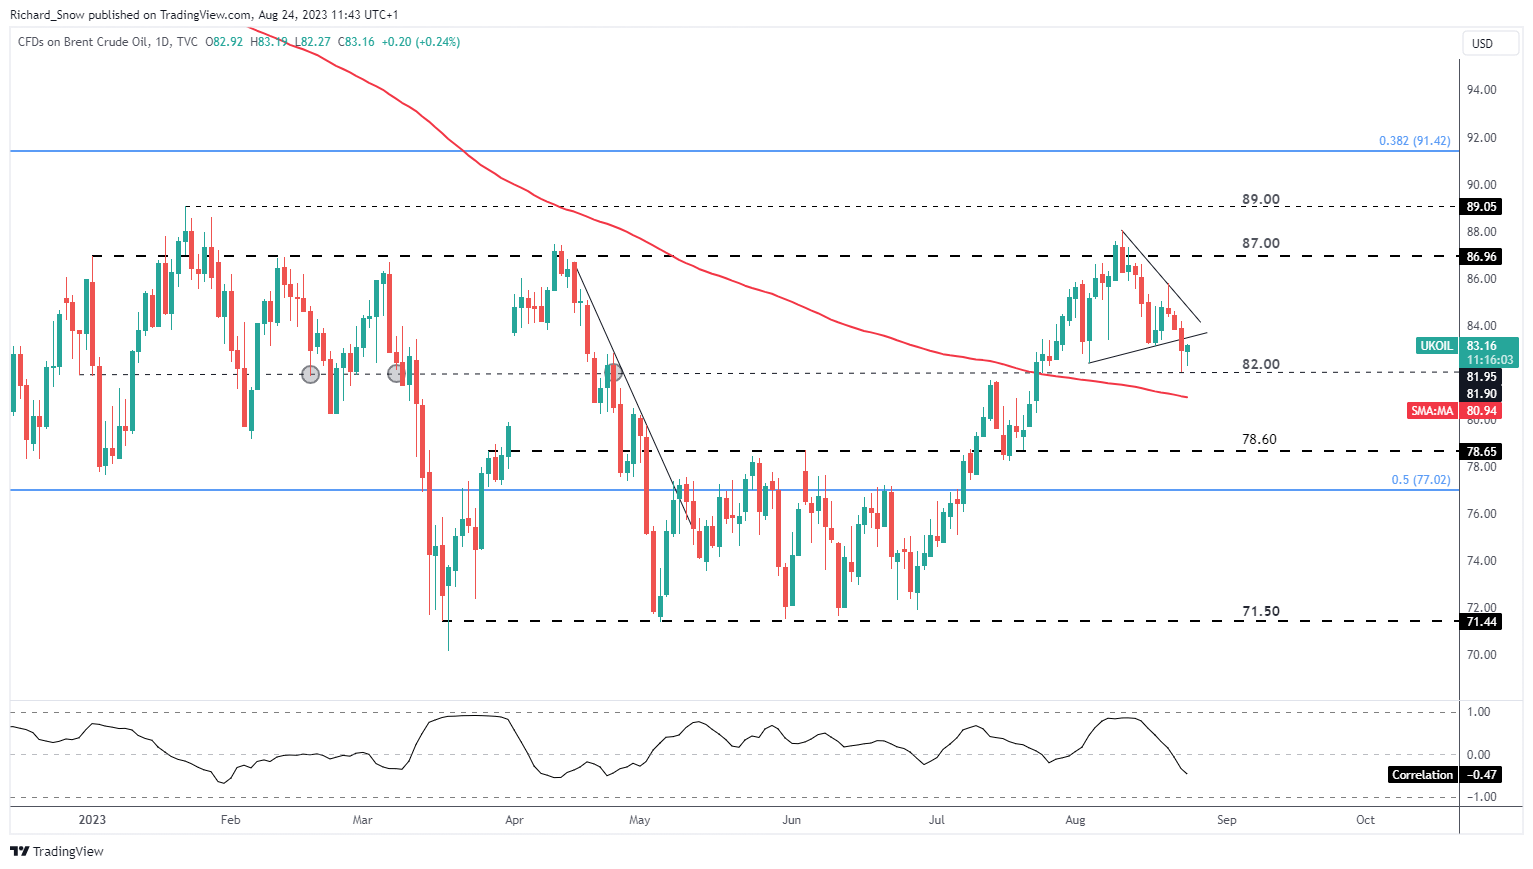
Source: TradingView, prepared by Richard Snow
The weekly chart shows oil’s tendency to trade within the defined trading range between $71.50 and $89, frequently testing the lower bound throughout April and June this year. $89 is once again instrumental in capping oil prices despite tighter supply – witnessed by the touch and run exhibited via the weekly doji candle. Subsequent selling has ensued and we’re on track for a second week of lower prices. The longer-term outlook suggests oil prices may rise again towards $89 if the dollar, yields remain elevated alongside worsening Chinese and European economic data which naturally leads to concerns around global growth and oil demand.
Brent Crude Oil Weekly Chart

Source: TradingView, prepared by Richard Snow

IG Client Sentiment Hints at Short-Term Weakness
IG Client Sentiment (WTI Oil)

Source: TradingView, prepared by Richard Snow
Oil- US Crude:Retail trader data shows 53.60% of traders are net-long with the ratio of traders long to short at 1.16 to 1.We typically take a contrarian view to crowd sentiment, and the fact traders are net-long suggestsOil- US Crude prices may continue to fall.
Find out why the daily and weekly positioning data is important for the contrarian indicator (below):
| Change in | Longs | Shorts | OI |
| Daily | 8% | -17% | 2% |
| Weekly | -4% | -5% | -4% |
--- Written by Richard Snow for DailyFX.com
Contact and follow Richard on Twitter: @RichardSnowFX


