


Crude Oil Price Talking Points
The price of oil climbs to fresh monthly high ($93.74) as it extends the series of higher highs and lows from late last week, and crude may attempt to test the 200-Day SMA ($97.87) as it clears the October high ($93.64).
Oil Price Eyes 200-Day SMA After Clearing October High
The price of oil seems to be establishing an upward trend as it no longer responds to the negative slope in the 50-Day SMA ($86.26), and the advance from the September low ($76.25) may turn out to be a key reversal as Organization of Petroleum Exporting Countries (OPEC) plan to “adjust downward the overall production by 2 mb/d” starting in November.
As a result, higher oil prices could be on the horizon as OPEC appears to be bracing for slowdown in energy consumption, and it remains to be seen if the organization will continue to adjust its output schedule at the next Ministerial Meeting on December 4 as the most recent Monthly Oil Market Report (MOMR) shows a downward revision for oil demand.
Until then, the shift in OPEC production may keep the price of oil afloat especially as US output remains below pre-pandemic levels, and crude may attempt to retrace the decline from the August high ($98.65) as it takes out the opening range for November.
With that said, the price of oil may continue to carve a series of higher highs and lows as it appears to be bouncing off of trendline support, and crude may attempt to test the 200-Day SMA ($97.87) as it clears the October high ($93.64).
Crude Oil Price Daily Chart
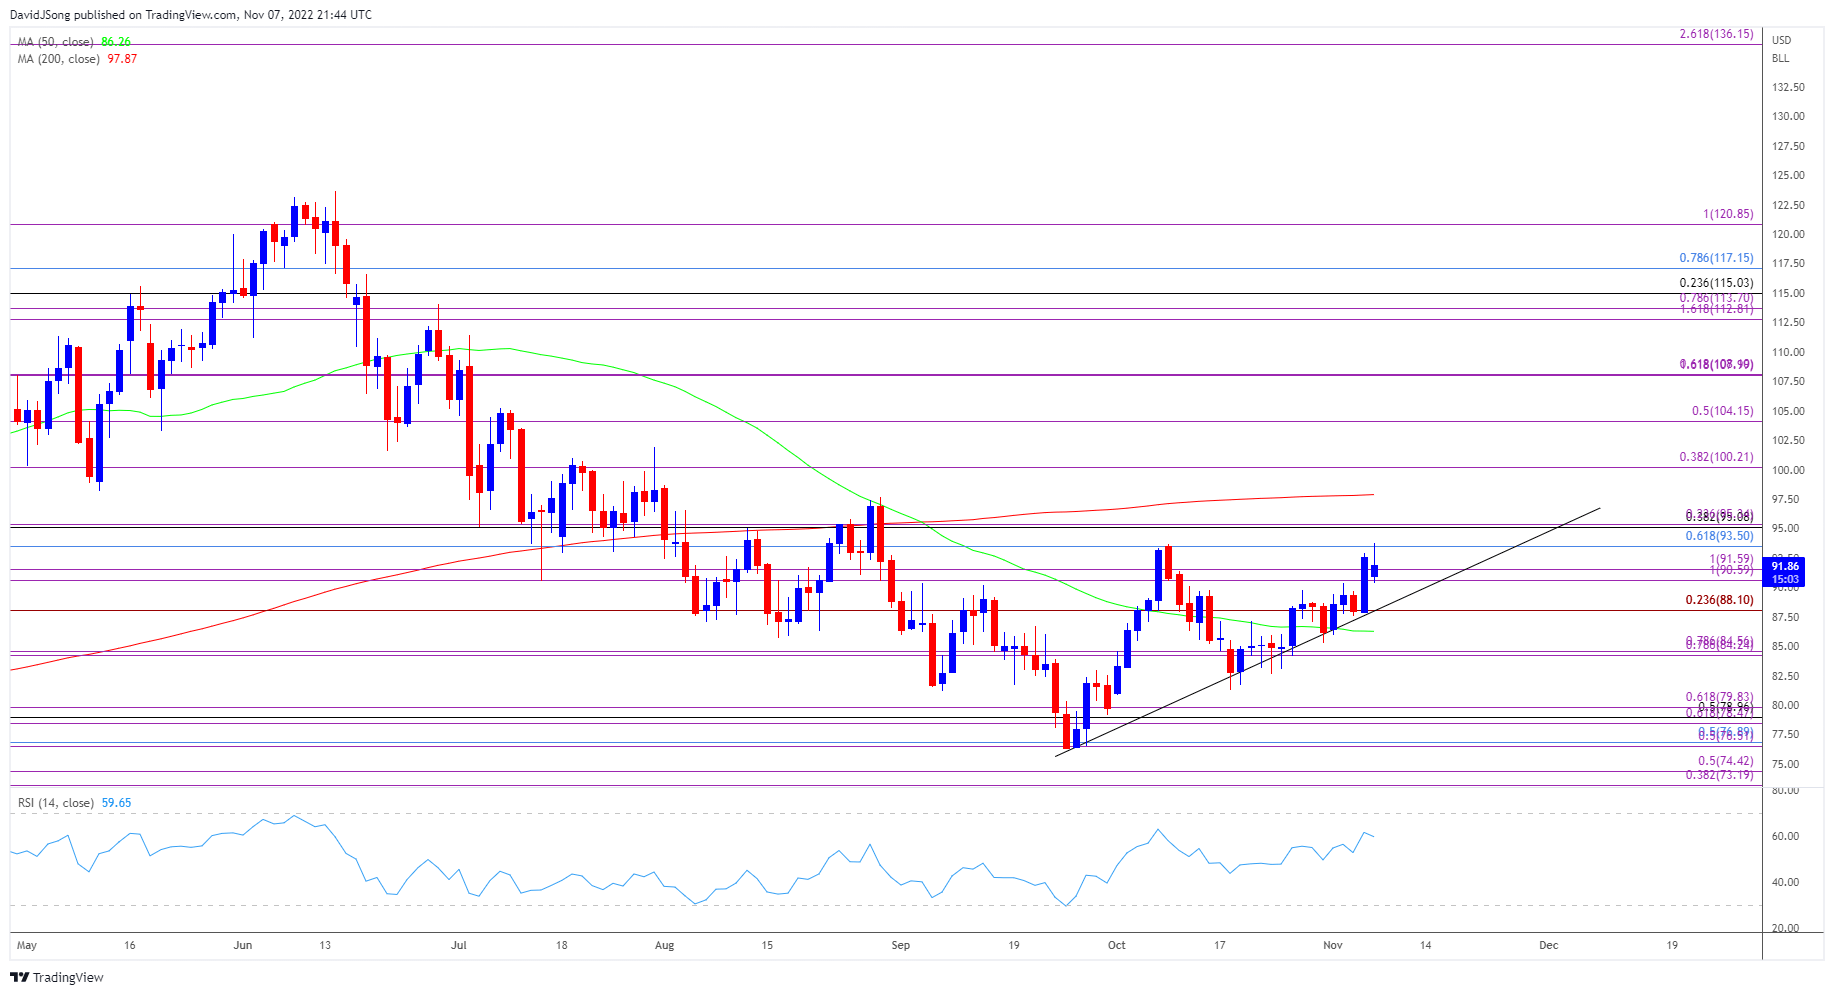
Source: Trading View
- The price of oil seems to be establishing an upward trend as it no longer responds to the negative slope in the 50-Day SMA ($86.26), and the advance from the September low ($76.25) may turn out to be a key reversal as crude clears the October high ($93.64).
- Need a break/close above the Fibonacci overlap around $93.50 (61.8% retracement) to $95.30 (23.6% expansion) to raise the scope for a test of the 200-Day SMA ($97.87), with a break above the August high ($98.65) opening up the $100.20 (38.2% expansion) region.
- Next area of interest comes in around $104.20 (50% expansion), but failure to clear the overlap around $93.50 (61.8% retracement) to $95.30 (23.6% expansion) may push the price of oil back towards trendline support if it struggles to hold above the $90.60 (100% expansion) to $91.60 (100% expansion) region.
Trading Strategies and Risk Management
Becoming a Better Trader
Recommended by David Song
--- Written by David Song, Currency Strategist
Follow me on Twitter at @DavidJSong


