Article by IG Chief Market Analyst Chris Beauchamp
Nasdaq 100, S&P 500, CAC40 Analysis and Charts
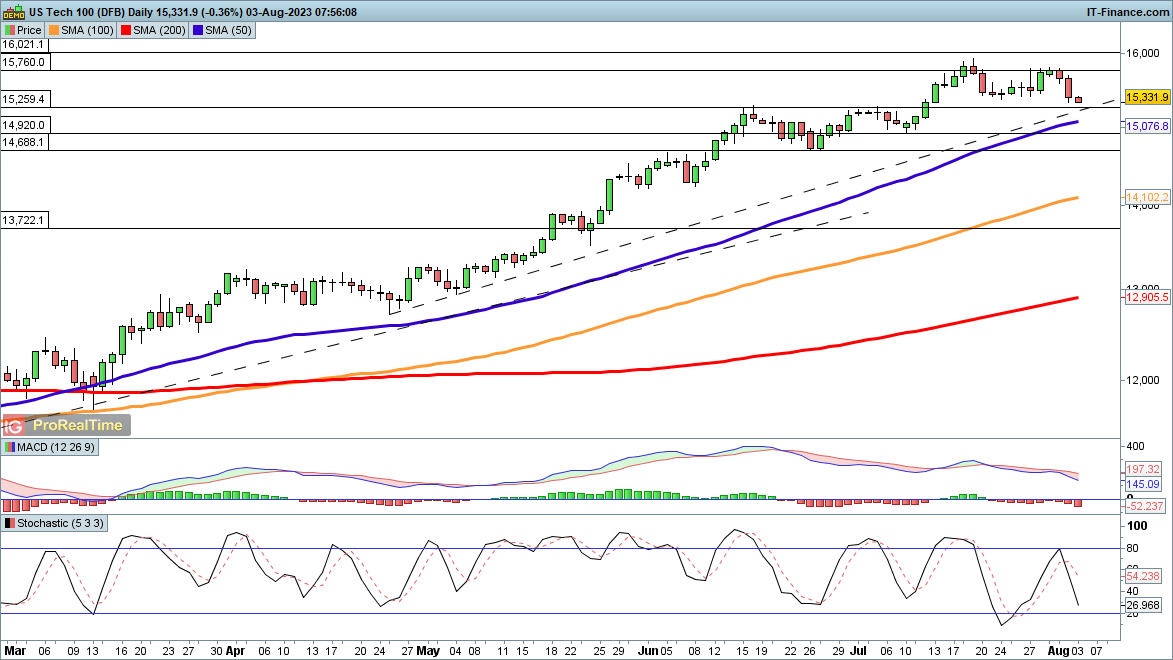
Nasdaq 100 hits three-week low
The index has fallen to its lowest level in three weeks, as the US debt downgrade provides a catalyst for a sell-off. Additional declines target rising trendline support from the April lows, and then below this the 50-day SMA (currently 15,076). Below this, short-term support may be found at 14,920 and then at 14,688. Having rallied some 40% this year, the index is likely overdue a serious pullback, which nonetheless leaves the uptrend intact.
It would take a much bigger move to put a real dent in the uptrend, likely below 14,000.
Nasdaq 100 Daily Price Chart

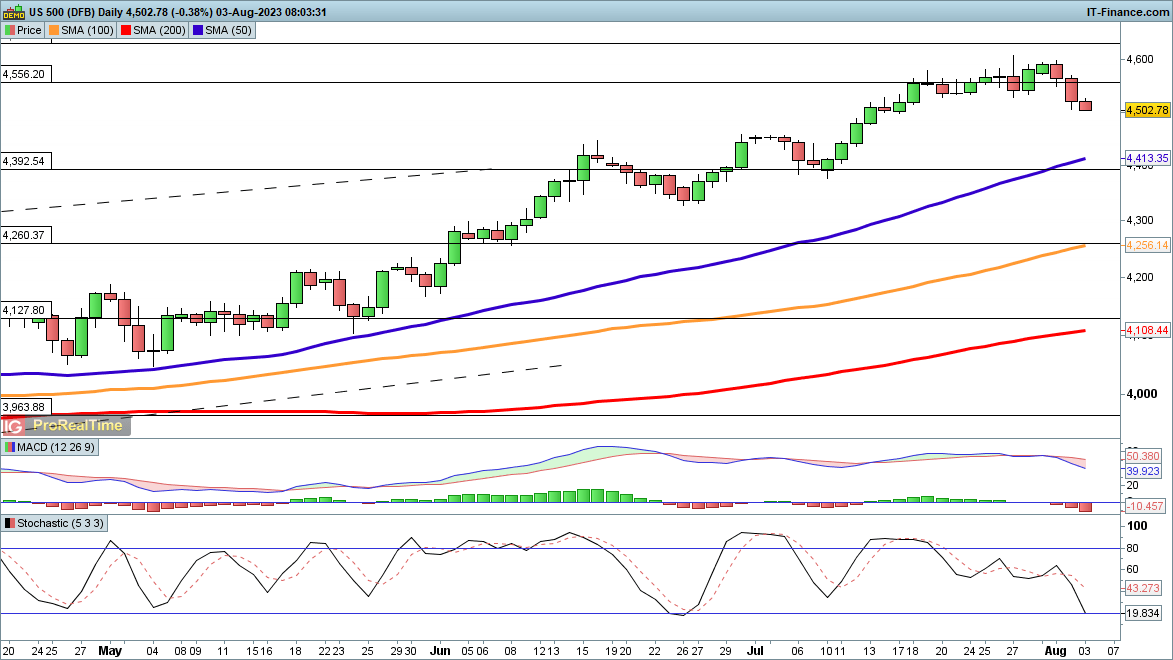
S&P 500 is under pressure again
This index has seen further selling this morning, pushing it to a level not seen since early July. The 50-day SMA looms large as possible support, while below this the 4392 area is bound to be of interest, given it was support in July.
As yet there is little sign of a recovery, but a move back above 4550 would signal that the buyers are in charge once more.
S&P 500 Daily Price Chart

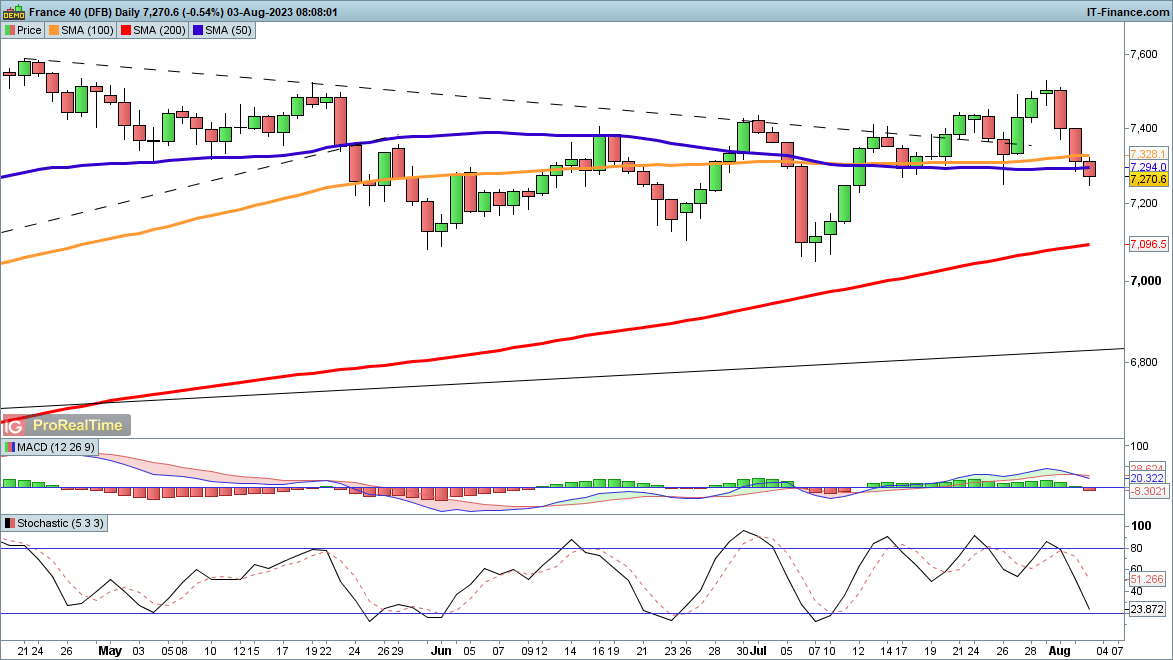
CAC40 sinks further
European markets took the US downgrade worse than Wall Street it seems. The CAC40 has given up the gains of late July when a breakout above trendline resistance finally seemed to have taken place. Further losses now take the index on towards the 200-day SMA (currently 7096). This would also take it back to the early July lows.
At present a move back above 7350 might indicate that a low is in place, and this would then put the index on course to target 7500 again.
CAC40Daily Price Chart