Article by IG Chief Market Analyst Chris Beauchamp
Nasdaq 100, Nikkei 225, CAC40 Analysis and Charts
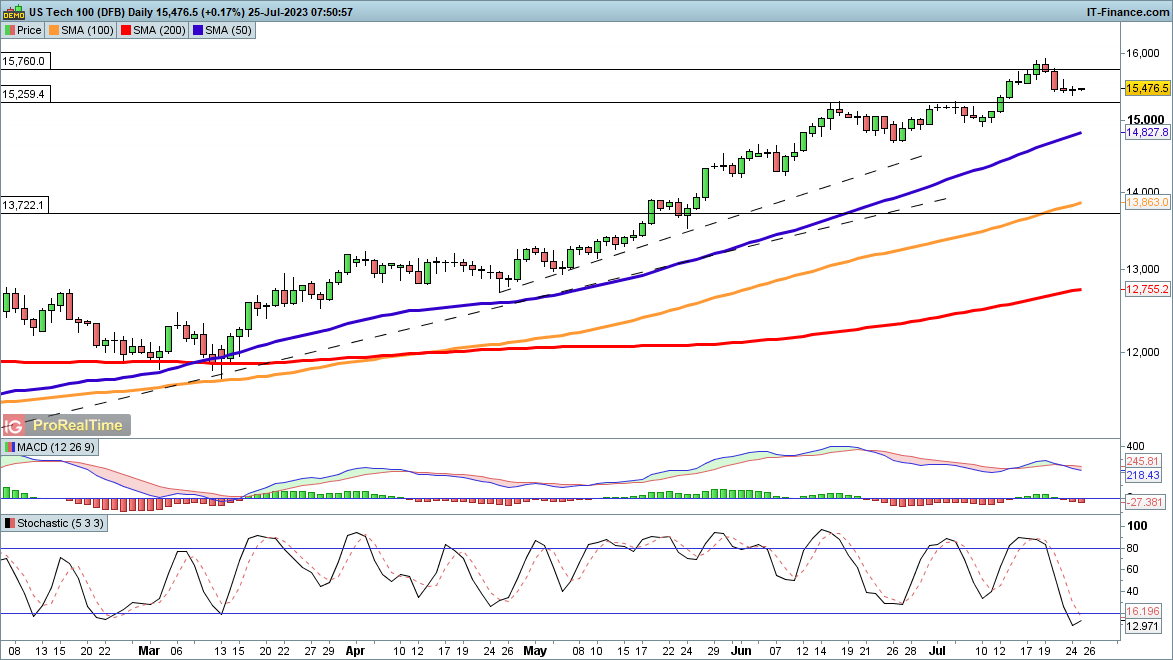
Nasdaq 100 sees buyers step in
Shallow pullbacks continue to be the norm for this index, and already buyers are stepping in after the losses on Wednesday and Thursday last week. For now, the 15,400 level has been firmly defended, and further gains will target last week’s highs around 15,930. Above this, a fresh higher high for this relentless uptrend will have been created.
Sellers will want a reversal back below 15,400 that can potentially open the way to the 50-day SMA and the 14,900 level that marked support earlier in July.
Nasdaq 100 Daily Price Chart

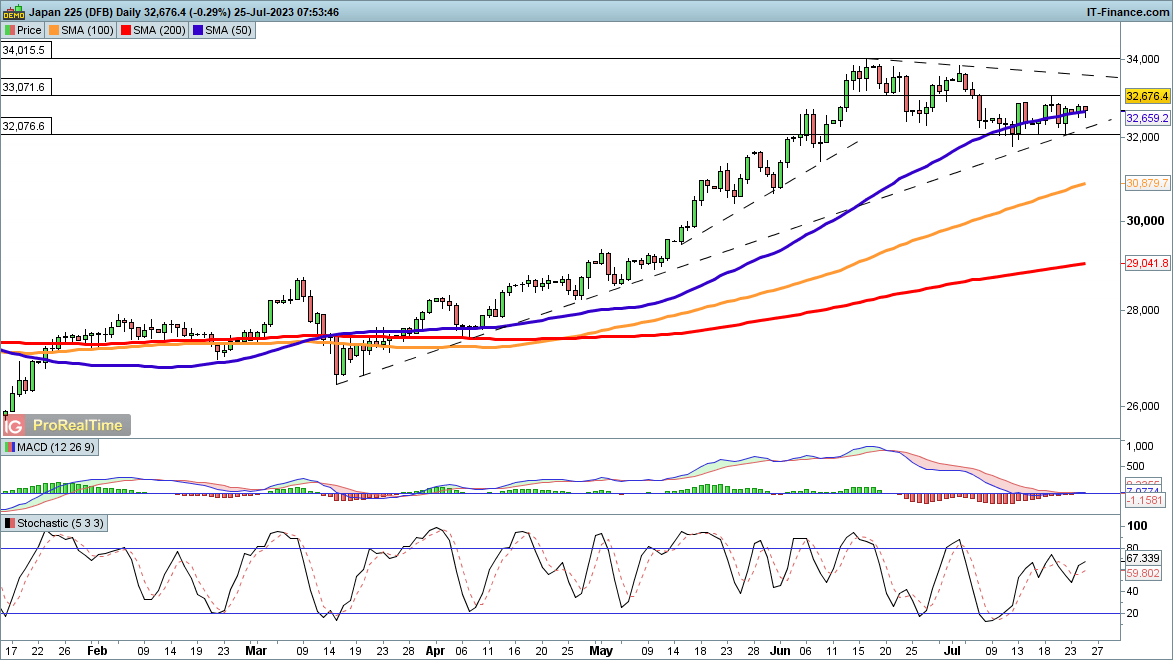
Nikkei 225 recovery goes on
The index continues to carve out a rounded bottom, with the latest reports of further support for the Chinese economy helping to lift spirits.Gains above 33,000 have proven impossible to sustain over the course of July, but buyers have repeatedly stepped in around 32,000, stalling any deeper pullback from the June highs. Above 33,000 a move back to the June highs seems to beckon.
A daily close below 32,000 is needed to provide an indication that a deeper pullback is at hand, perhaps toward the 100-day SMA.
Nikkei 225 Daily Price Chart
Foundational Trading Knowledge
Trading Discipline
Recommended by IG
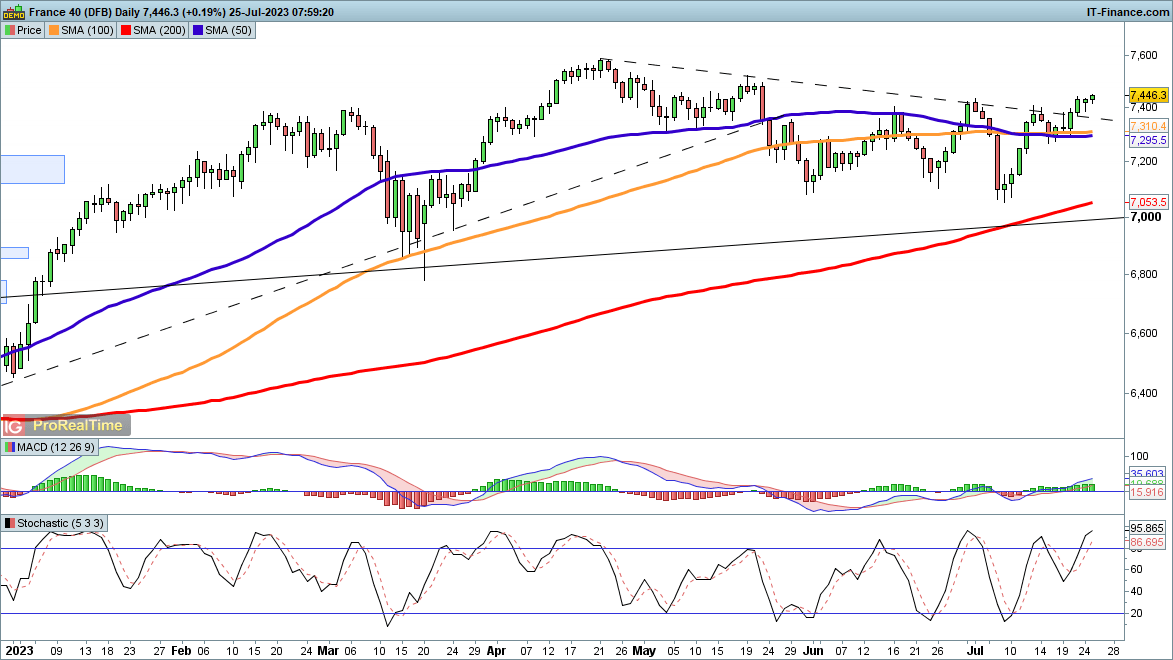
CAC40 breakout continues
The index continues to make headway above trendline resistance from the April highs.The breakout of the past week continues to reinforce the bullish view. The next target will be the May lower high at 7500, and then on to April’s peak at 7580.Above this, the price will move to a new higher high and fresh record highs.
A move back below 7300 would be needed to suggest that the sellers are back in control in the short-term, although the overall move higher remains in place.
CAC40 Daily Price Chart