


US Stock Market Key Points:
- TheS&P 500, Dow, and Nasdaq 100 surge following lower US Treasury yields and weaker USD
- ISM PMI Manufacturing activity nears contraction territory. Prices component also softens
- All eyes on tomorrow’s JOLTS job openings report
Trade Smarter - Sign up for the DailyFX Newsletter
Receive timely and compelling market commentary from the DailyFX team
Most Read: US Dollar Majors, Stocks, Gold & Oil - Weekly Technical Outlook
After a negative end to September and Q3 for stocks due to concerns of a global economic slowdown caused by tighter financial conditions, the main US indices climbed today after the release of weaker-than-expected Manufacturing activity. The scenario in which bad news is good news seems to be having an impact given the pace of Fed rate hikes. With weaker Economic Calendar news, expectations for FOMC hawkishness pare back which can lead to a pullback in yields, the US dollar depreciates, and equities breathe a sigh of relief.
In September, the Dow, S&P 500 and Nasdaq 100 suffered declines of 8.8%, 9.3% and 10.5%, respectively, which impacted third quarter results by accumulating a loss of 6.6%, 5.28% and 4.11%. Price pressures and rising interest rates are to blame for the decline in the US indices. Just last week, the 10-year Treasury yield hit 4.0%, a level not seen in more than a decade.
But today, yields managed to pull back and weaker-than-expected ISM manufacturing PMI data showed that the sector's activity is close to contraction territory, helping yields to retract some more. At the same time, the prices paid component showed a decline, giving investors a reason to pull back and wonder if the FOMC rate hikes are now having an effect on the economy and question if this is the kind of scenario the Fed would like to see to soften the pace of the tightening cycle.
At the closing bell, the Dow and the S&P 500 posted gains of 2.67% and 2.59%, respectively. All sectors of the S&P rose, with energy leading the advancers. Crude Oil prices jumped more than 4.87%, taking the WTI contract to $83.37 at the time of writing. The OPEC+ meeting is scheduled for October 5 and markets are expecting a supply cut of 1 million bpd to respond to falling prices. This would mark the largest cut since 2020.
On the same note, the Nasdaq 100 also rallied and finished with a 2.36% gain despite Tesla losing more than 8% amid news that the electric vehicle maker has missed third quarter sales.

TECHNICAL OUTLOOK
From a technical perspective, October is usually a bullish month marked by increased volatility and volume. Today, the S&P 500 has confirmed that positive kick-start. After bouncing from its lowest point since November 2020, the index has closed above 3660. If the bulls manage to hold this level, the next push could be towards the 3723 area where a major resistance zone is located and then to 3880. Conversely, if 3571 is broken, 3541 could follow.
S&P 500 Mini Futures Weekly Chart
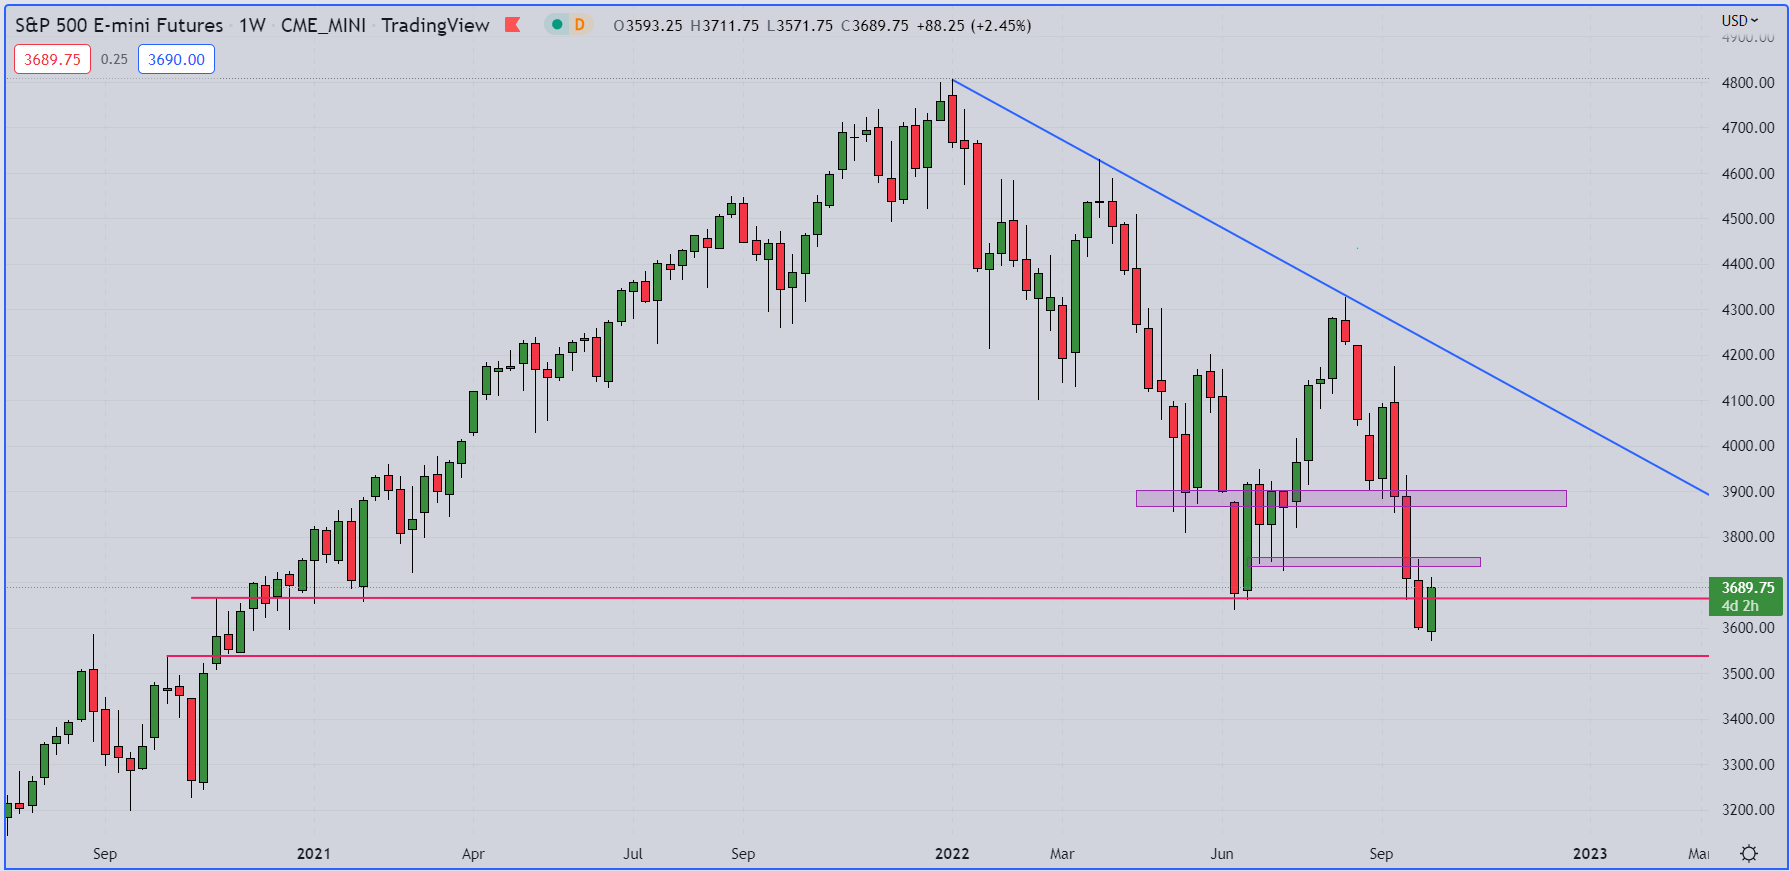
S&P 500 Mini Futures Chart. Prepared UsingTradingView
Looking ahead, all eyes are on tomorrow's JOLTS job report as labor openings are a leading indicator of overall employment.

EDUCATION TOOLS FOR TRADERS
- Are you just getting started? Download thebeginners’ guide for FX traders
- Would you like to know more about your trading personality? Take theDailyFX quizand find out
- IG's client positioning data provides valuable information on market sentiment.Get your free guideon how to use this powerful trading indicator here.
---Written by Cecilia Sanchez-Corona, Research Team, DailyFX


