


USD/JPY Price, Chart, and Analysis
- Tokyo’s price pressures remain hot.
- USD/JPY trapped ahead of important US economic data.

Annual inflation in Japan’s largest city, Tokyo, continues to push higher, with the core rate touching 4.3% in January, the highest level in over four decades. The Bank of Japan will have noted this sharp move higher, and commentary yesterday from the IMF, as it looks to push inflation back to its 2% target. The IMF yesterday said that inflation in Japan was accelerating and that further upside risks remain. The IMF suggested that the Bank of Japan (BoJ) must be ready to withdraw economic stimulus quickly if inflation continues to rise and provide the market with clear guidance on any future policy changes.
International Monetary Fund – Japan 2023 Article IV Mission

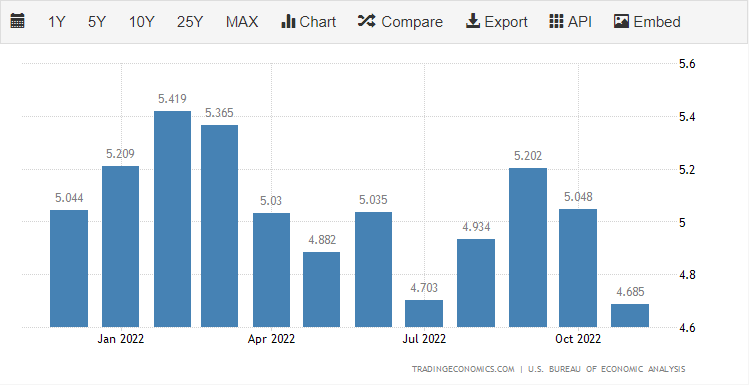
Later in today’s session, the December US core PCE data will be released to an expectant audience. This is the Fed’s preferred measure of inflation and is expected to show price pressures easing further. Market expectations are for an annual reading of 4.4% compared to 4.7% in November.
Core PCE Lower for the Fourth Straight Month?
The technical outlook for USD/JPY is mixed with a medium-term trend of lower highs meeting a short-term trend of higher lows. The pair currently trades in a very narrow range and is primed to make a break. USD/JPY has tracked the 20-day moving average (red line) lower since early November, while a negative 50-day/200-day crossover printed on January 12. In the short-term, the US dollar will be the driver of the next move with today’s inflation data followed by the Fed’s monetary policy decision and the latest look at the US jobs market (NFPs) next week.
USD/JPY Daily Price Chart – January 27, 2023
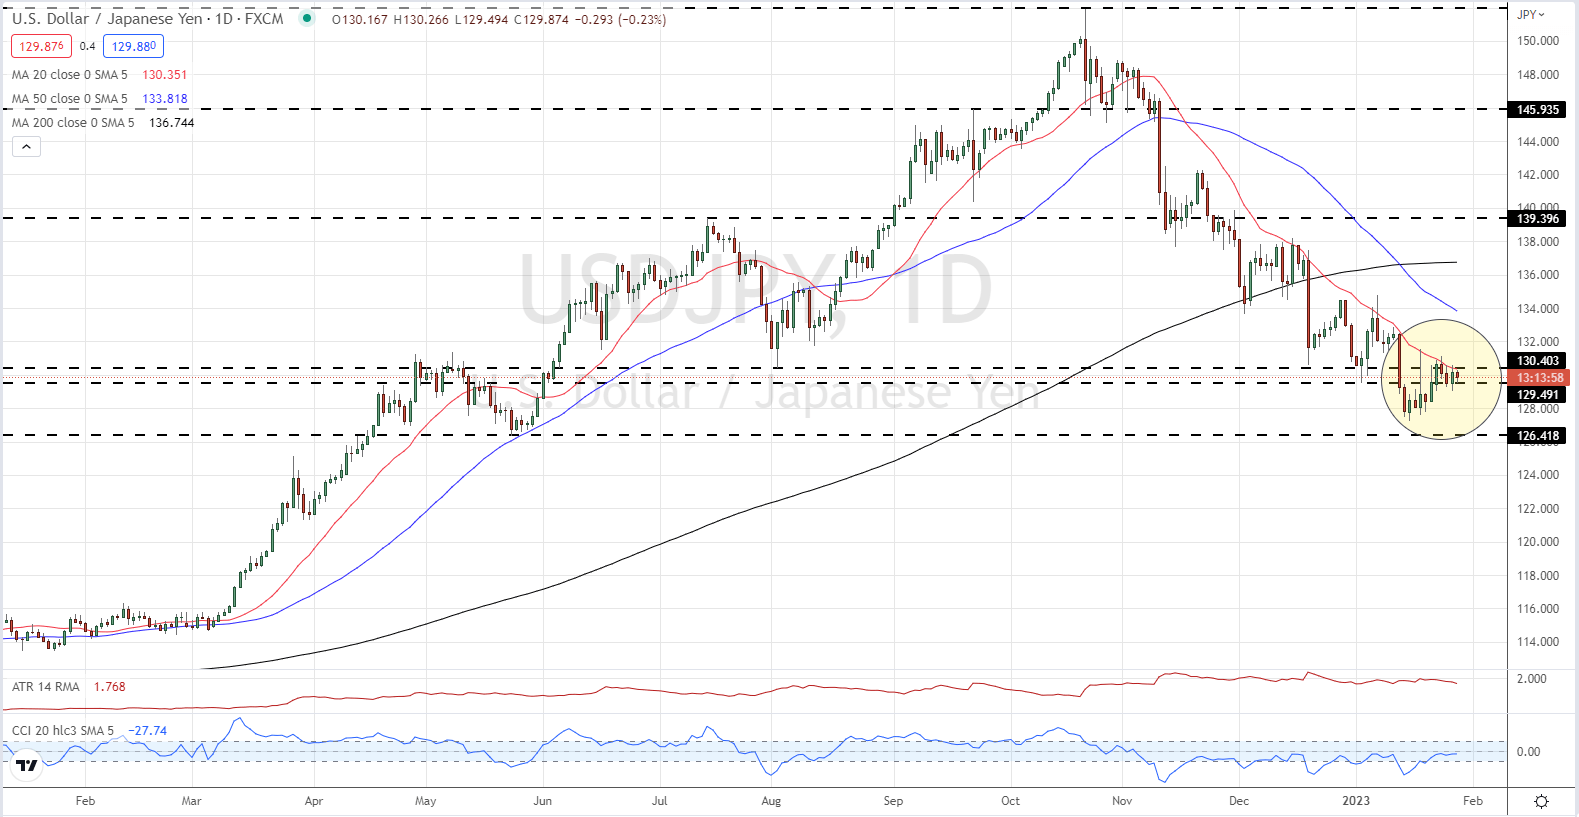
Chart via TradingView
| Change in | Longs | Shorts | OI |
| Daily | -2% | 2% | 0% |
| Weekly | 12% | -16% | -6% |
Retail Trade Data - Hefty Weekly Positional Changes
Retail trader data show 42.17% of traders are net-long with the ratio of traders short to long at 1.37 to 1.The number of traders net-long is 3.11% lower than yesterday and 20.54% lower from last week, while the number of traders net-short is 4.12% lower than yesterday and 36.28% higher from last week.
We typically take a contrarian view to crowd sentiment, and the fact traders are net-short suggests USD/JPY prices may continue to rise. Positioning is less net-short than yesterday but more net-short from last week. The combination of current sentiment and recent changes gives us a further mixed USD/JPY trading bias.
What is your view on the USD/JPY – bullish or bearish?? You can let us know via the form at the end of this piece or you can contact the author via Twitter @nickcawley1.


