


Japanese Yen, USD/JPY, US Dollar, BoJ, Ueda, Momentum - Talking Points
- USD/JPY has steadied after testing higher ground
- The BoJ is in a ‘do nothing’ mode and that could help Yen
- If the trend is intact, will USD/JPY stretch higher?

The Japanese Yen has been a thorn and a crown for traders over the last week, providing both headaches and bliss in a wild ride of price action.
The fundamental backdrop for Japanese monetary policy remains unchanged for now despite Kazuo Ueda taking the reigns last month as the new Governor of the Bank of Japan (BoJ).
It appears that it is a case of ‘steady as she goes’ for the technocrat and that might be just what the job requires at a time when other central banks are looking to pause on their tightening stance.
The BoJ have a policy rate of -0.10% and they are maintaining yield curve control (YCC) by targeting a band of +/- 0.50% around zero for Japanese Government Bonds (JGBs) out to 10 years.
EUR/JPY put on an astronomical rally and took out several previous highs to make a 15-year peak before collapsing back into the range.
Meanwhile, USD/JPY lacked the momentum to mark new territory to the upside and failed to maintain the bullishness when it retreated back to familiar levels.
Trade Smarter - Sign up for the DailyFX Newsletter
Receive timely and compelling market commentary from the DailyFX team
USD/JPY TECHNICAL ANALYSIS
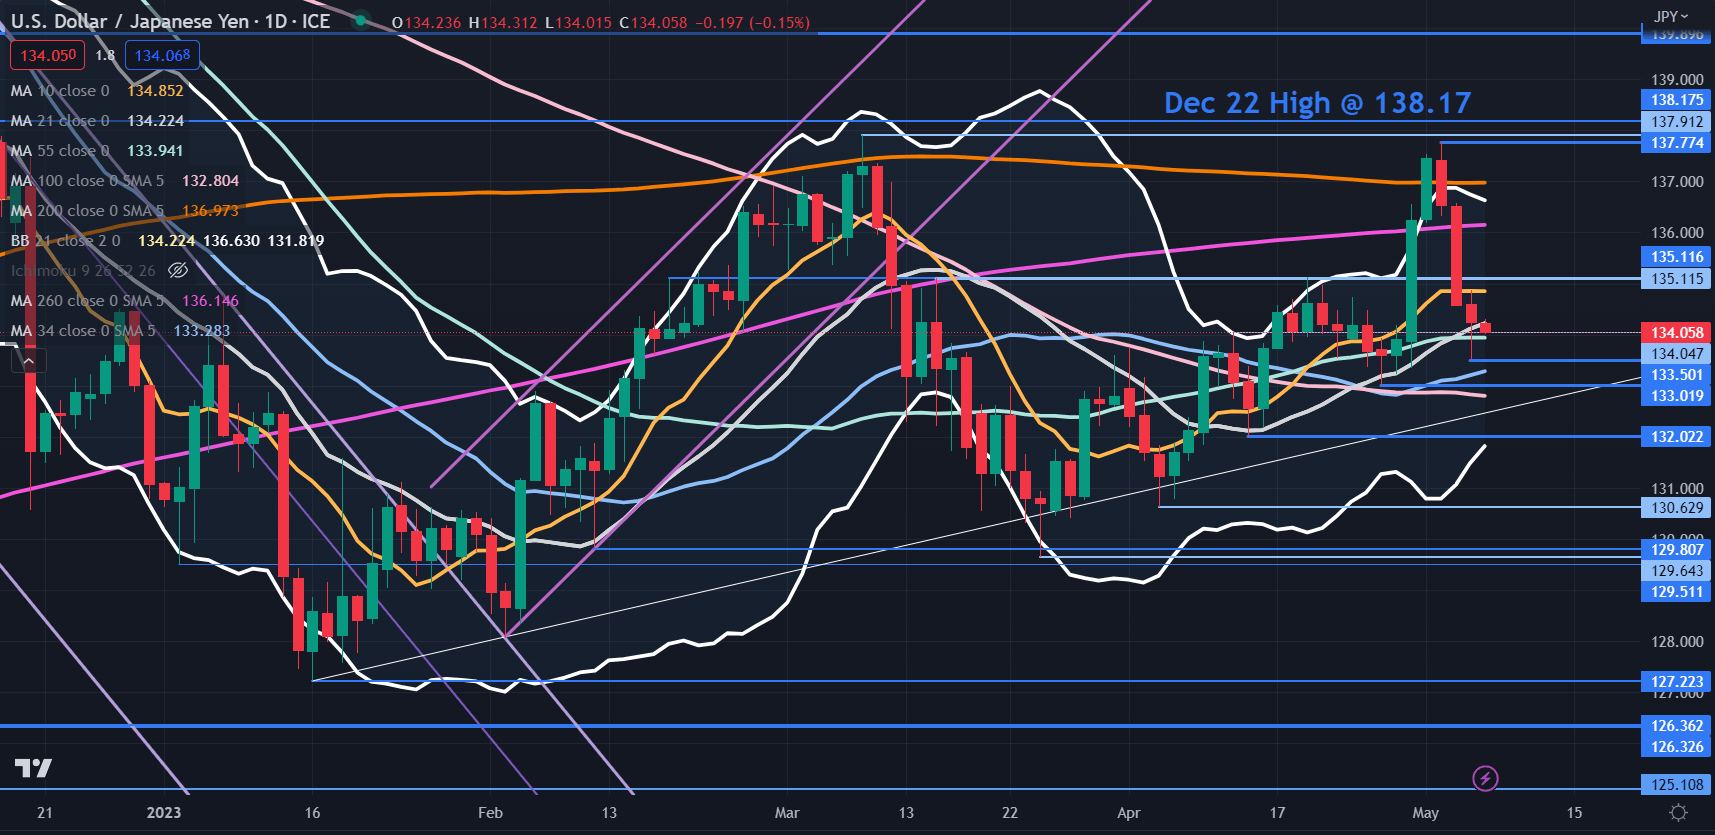
The USD/JPY rally on Monday this week broke above the upper band of the 21-day simple moving average (SMA) based Bollinger Band. It then closed back inside the band to signal a pause in the bullish run and what turned out to be a reversal.
The focus going forward is that the currency pair remains in an ascending trend channel for now but is questioning the bullish momentum.
If USD/JPY closes below 132.50 it will be below all period daily SMAs and the positive gradient trend line. From a technical perspective, that could indicate that range trading conditions have been reinforced.
The price action this week has revealed 135.11 as a pivotal breakpoint and it may offer resistance. Further up, there are three previous highs in the 137.77 – 138.17 area that might provide resistance.
On the downside, the prior lows at 133.50, 133.00 and 132.00 may lend support ahead of the 129.50 – 129.80 potential support zone.
{{GUIDE|HOW_TO_TRADE_USDJPY}}
--- Written by Daniel McCarthy, Strategist for DailyFX.com
To contact Daniel, use the comments section below or @DanMcCathyFX on Twitter


