

Gold, XAU/USD, Silver, XAG/USD - Outlook:
- Next support for gold: 1805, 1785, 1720.
- Bearish head and shoulders pattern triggers in silver.
- What is the outlook and the key levels to watch?
For a detailed discussion on the fundamental and technical outlook on precious metals download DailyFX's fourth quarter trading guide. It's free!

Gold and silver have below their respective multi-week range, pointing to further losses in the near term amid rising US Treasury yields.
US Treasury 10-year yield hit a 16-year high last week on the growing conviction of higher-for-longer interest rates, weighing on the zero-yielding precious metals. On technical charts, the US Treasury 10-year yield’s break above the 2018 high of 3.26% has opened the way toward the pre-Great Financial Crisis high of 5.33%.
Rising nominal interest rates coupled with easing price pressures/inflation expectations have pushed up real rates, raising the opportunity cost of holding the zero-yielding yellow metal. See “High Real Yields Starting to Bite Gold? XAU/USD Price Setup Ahead of US CPI,” published August 10.
XAU/USD Daily Chart
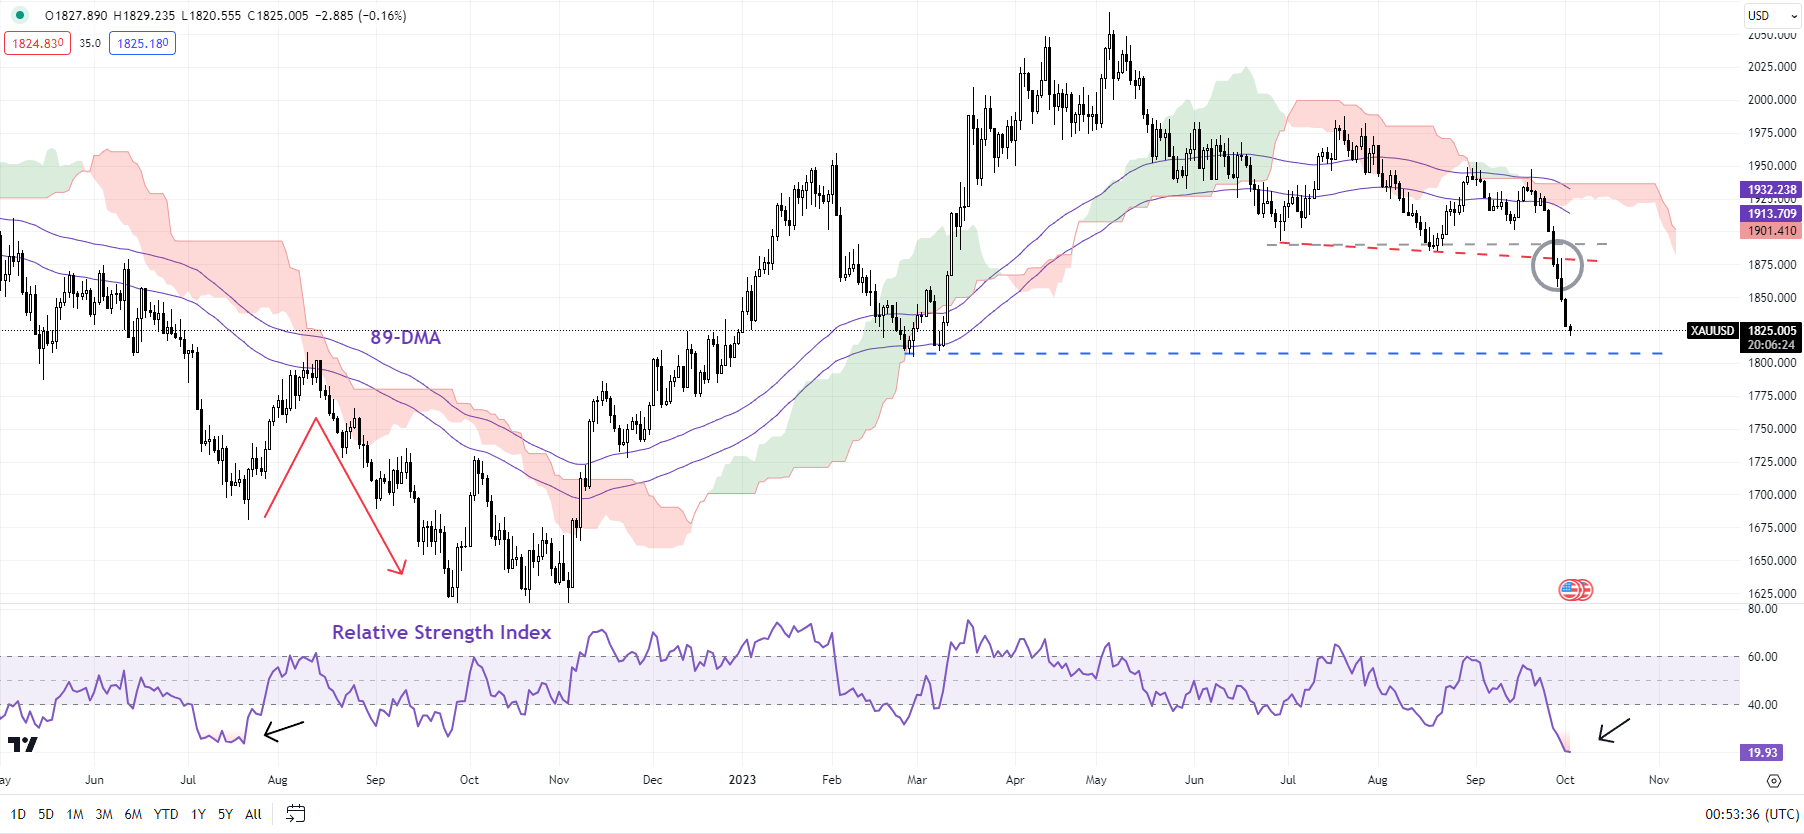
Chart Created Using TradingView
Fed Governor Michelle Bowman reinforced the hawkish view on Monday saying she remains willing to support another increase in the central bank’s policy rate at a future meeting if incoming data shows progress on inflation has stalled or is too slow. Furthermore, the temporary resolution to avert a US government shutdown removed the prospect of safe-haven bids in gold.
Gold: Bearish triangle triggers
On technical charts, XAU/USD has fallen below vital support on the 200-day moving average, around the June/August low of 1885-1890. The importance of this support was highlighted in “Gold, Silver Forecast: It’s Now or Never for XAU/USD, XAG/USD,” published on August 13. The break below has paved the way toward the February low of 1805, near strong support on the 200-week moving average. Subsequent support is at 1785 followed by 1720 (the 76.4% retracement of the 2022-2023 rally).
XAU/USD Weekly Chart
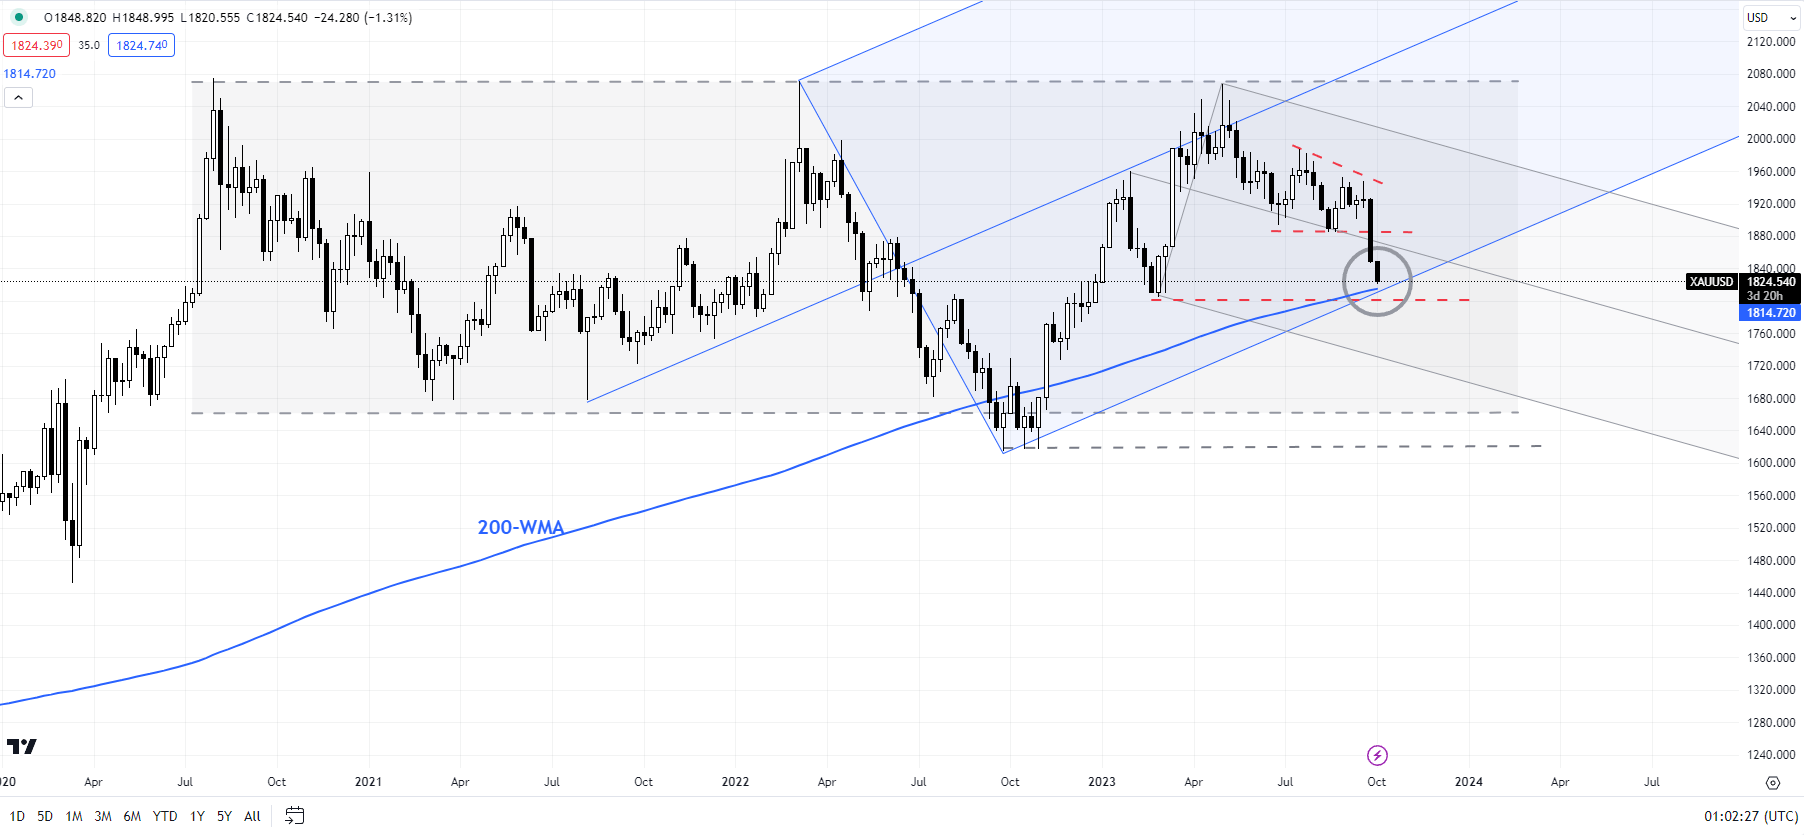
Chart Created Using TradingView
Gold is looking deeply oversold on the daily charts with the 14-day Relative Strength Index now below 20 – a level that was associated with a rebound in mid-2022. However, it wasn’t enough to end the slide. The implication is that deeply oversold conditions raise the odds of a corrective bounce but may not necessarily terminate the downtrend.
A decisive break below 1805 would seal the possibility that the spectacular one-year rally since early 2022 was corrective and not the start of a new uptrend – a point highlighted in recent months. See “Gold Could Find It Tough to Crack $2000”,published March 28, and “Gold Weekly Forecast: Is it Time to Turn Cautious on XAU/USD?” published April 16.
XAG/USD Daily Chart
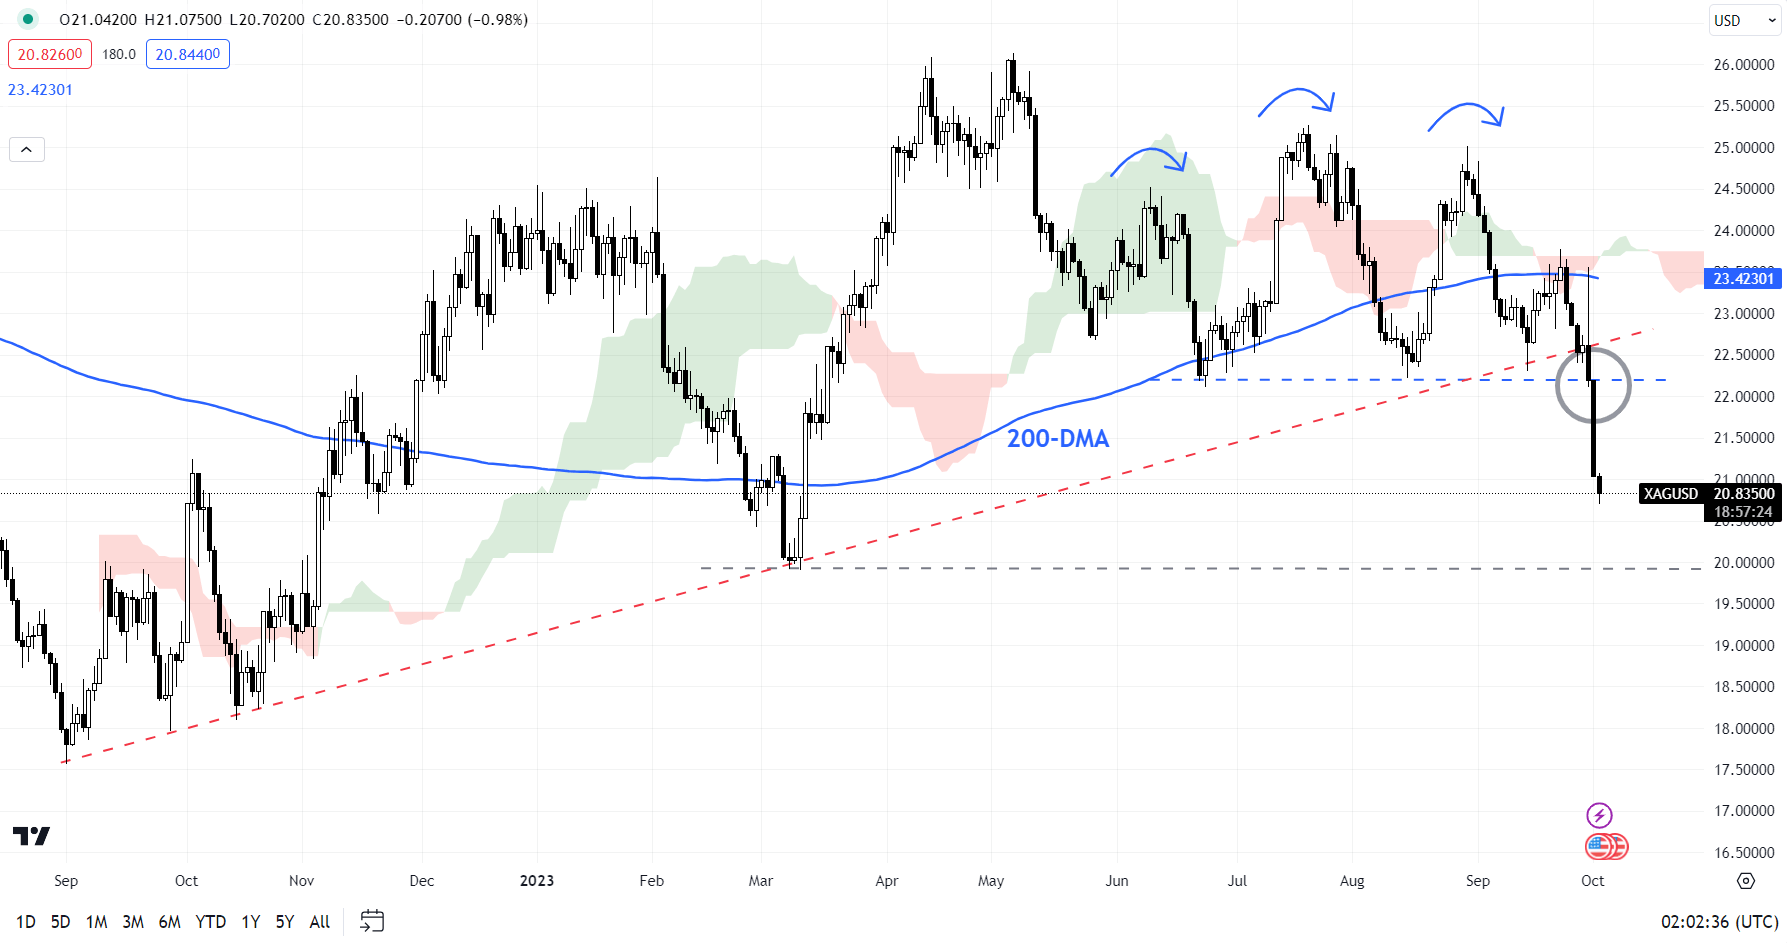
Chart Created Using TradingView
Silver: Head & shoulders pattern triggers
XAG/USD has broken below key converged support, including an uptrend line from late 2022, coinciding with a horizontal trendline from June that came at about 22.00. The break has triggered a bearish head & shoulders pattern – the left shoulder is at the June high, the head is at the July high, and the right shoulder is at the August high – opening the way toward the March low of 19.85. The bearish move is also associated with a fall below the 200-day moving average, suggesting the uptrend from late 2022 has reversed.

--- Written by Manish Jaradi, Strategist for DailyFX.com
--- Contact and follow Jaradi on Twitter: @JaradiManish